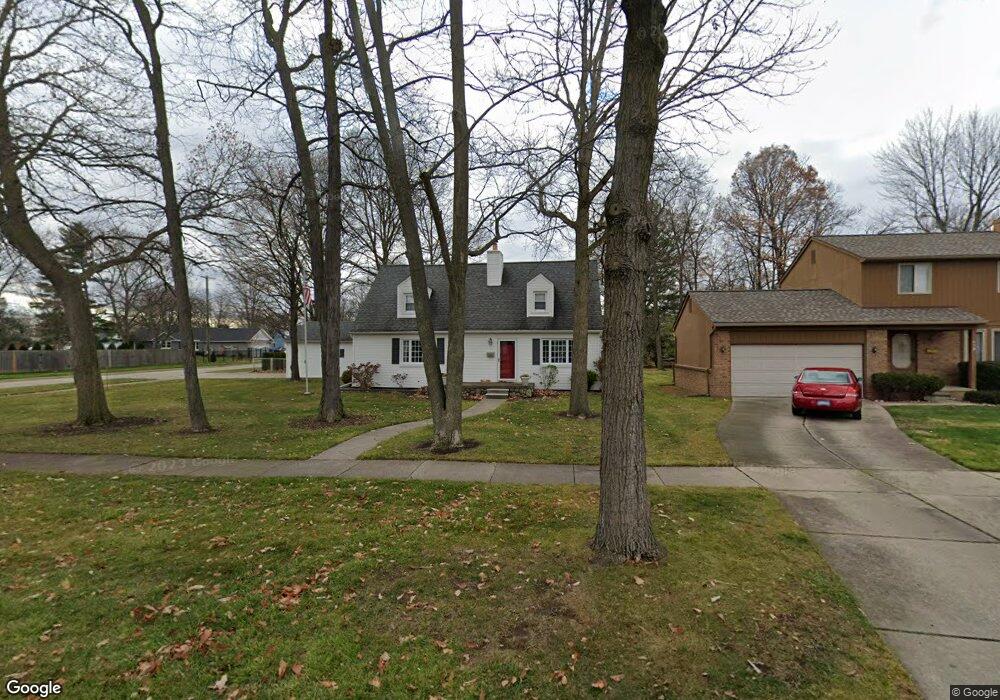
426 Redruth Ave Unit Bldg-Unit Clawson, MI 48017
Estimated Value: $363,000 - $400,000
3
Beds
2
Baths
1,638
Sq Ft
$227/Sq Ft
Est. Value
About This Home
This home is located at 426 Redruth Ave Unit Bldg-Unit, Clawson, MI 48017 and is currently estimated at $372,550, approximately $227 per square foot. 426 Redruth Ave Unit Bldg-Unit is a home located in Oakland County with nearby schools including Clawson Middle School, Clawson High School, and Japhet School.
Ownership History
Date
Name
Owned For
Owner Type
Purchase Details
Closed on
Dec 6, 2023
Sold by
Loperena Eduardo Otero
Bought by
Woodward West Holdings Llc
Current Estimated Value
Purchase Details
Closed on
Jul 1, 2021
Sold by
Kuivenhoven Matthew C and Kuivenhoven Lydia
Bought by
Loperena Eduardo Otero
Home Financials for this Owner
Home Financials are based on the most recent Mortgage that was taken out on this home.
Original Mortgage
$314,204
Interest Rate
2.9%
Mortgage Type
FHA
Purchase Details
Closed on
Jun 13, 2018
Sold by
Moynihan Kevin and Moynihan Kathryn
Bought by
Kuivenhoven Matthew C and Kuivenhoven Lydia
Create a Home Valuation Report for This Property
The Home Valuation Report is an in-depth analysis detailing your home's value as well as a comparison with similar homes in the area
Home Values in the Area
Average Home Value in this Area
Purchase History
| Date | Buyer | Sale Price | Title Company |
|---|---|---|---|
| Woodward West Holdings Llc | -- | None Listed On Document | |
| Loperena Eduardo Otero | $348,000 | Cislo Title Co | |
| Kuivenhoven Matthew C | $275,000 | Title Express Llc |
Source: Public Records
Mortgage History
| Date | Status | Borrower | Loan Amount |
|---|---|---|---|
| Previous Owner | Loperena Eduardo Otero | $314,204 |
Source: Public Records
Tax History
| Year | Tax Paid | Tax Assessment Tax Assessment Total Assessment is a certain percentage of the fair market value that is determined by local assessors to be the total taxable value of land and additions on the property. | Land | Improvement |
|---|---|---|---|---|
| 2025 | $10,239 | $163,990 | $0 | $0 |
| 2024 | $9,910 | $156,040 | $0 | $0 |
| 2023 | $6,748 | $152,020 | $0 | $0 |
| 2022 | $6,801 | $140,840 | $0 | $0 |
| 2021 | $5,664 | $131,520 | $0 | $0 |
| 2020 | $5,488 | $123,060 | $0 | $0 |
| 2019 | $5,670 | $112,210 | $0 | $0 |
| 2018 | $3,459 | $101,160 | $0 | $0 |
| 2017 | $3,438 | $96,730 | $0 | $0 |
| 2016 | $3,479 | $89,680 | $0 | $0 |
| 2015 | -- | $82,380 | $0 | $0 |
| 2014 | -- | $72,360 | $0 | $0 |
| 2011 | -- | $66,390 | $0 | $0 |
Source: Public Records
Map
Nearby Homes
- 515 S Marias Ave
- 659 Gargantua Ave
- 542 S Manitou Ave
- 135 Gerald Ave
- 101 Jefferson Ave
- 609 John M Ave
- 1512 Normandy Rd Unit 105
- 44 W Tacoma St
- 4401 Crooks Rd
- 4345 Crooks Rd Unit 36
- 45 E Tacoma St
- 4227 Crooks Rd
- 822 Phillips Ave
- 618 Mount Vernon Blvd
- 816 W Baker Ave
- 4905 Crooks A2 Rd
- 4909 Crooks Rd Unit D6
- 4909 Crooks Rd Unit 4
- 4510 Rosewold Ave
- 4921 Crooks Rd Unit N 3
- 426 Redruth Ave
- 412 Redruth Ave
- 423 S Bywood Ave
- 400 Redruth Ave
- 415 S Bywood Ave
- 512 Redruth Ave
- 357 S Bywood Ave
- 340 Redruth Ave
- 526 Redruth Ave
- 343 S Bywood Ave
- 505 S Bywood Ave Unit Bldg-Unit
- 505 S Bywood Ave
- 505 Redruth Ave
- 335 S Bywood Ave
- 536 Redruth Ave
- 328 Redruth Ave
- 515 Redruth Ave
- 327 S Bywood Ave
- 525 Redruth Ave
- 546 Redruth Ave
Your Personal Tour Guide
Ask me questions while you tour the home.