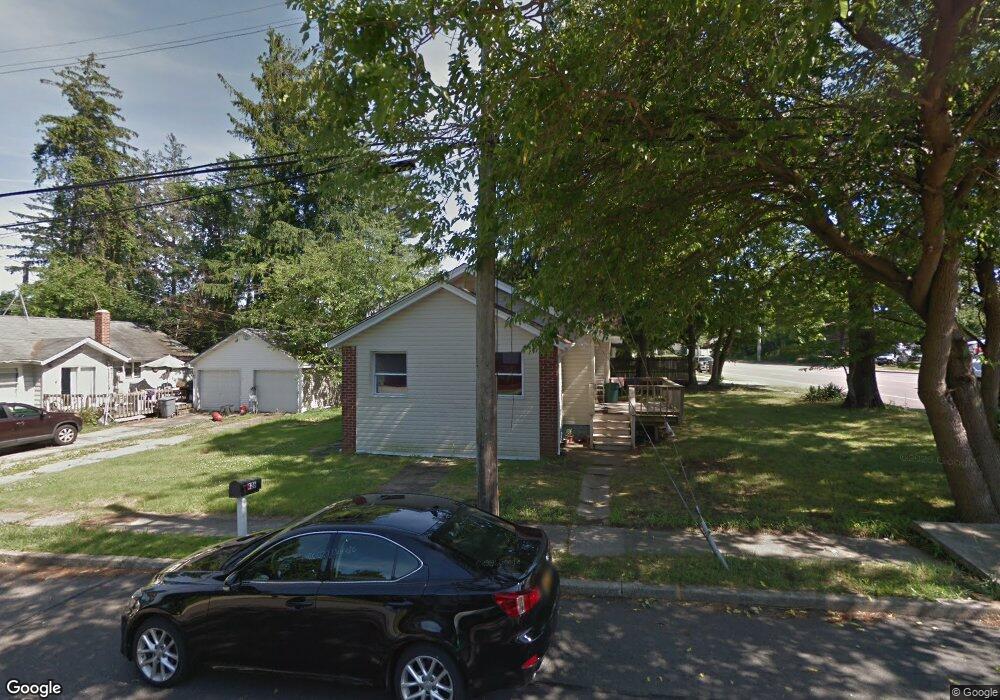
426 Richmond Blvd Ronkonkoma, NY 11779
Estimated Value: $496,000 - $559,000
3
Beds
2
Baths
1,020
Sq Ft
$526/Sq Ft
Est. Value
About This Home
This home is located at 426 Richmond Blvd, Ronkonkoma, NY 11779 and is currently estimated at $536,944, approximately $526 per square foot. 426 Richmond Blvd is a home located in Suffolk County with nearby schools including Cherokee Street Elementary School, Ronkonkoma Middle School, and Connetquot High School.
Ownership History
Date
Name
Owned For
Owner Type
Purchase Details
Closed on
Oct 10, 2017
Sold by
Real Onion Llc
Bought by
Chowdhury Anukul C and Roy Shilpi R
Current Estimated Value
Home Financials for this Owner
Home Financials are based on the most recent Mortgage that was taken out on this home.
Original Mortgage
$231,990
Outstanding Balance
$189,423
Interest Rate
3.87%
Mortgage Type
FHA
Estimated Equity
$347,521
Purchase Details
Closed on
Nov 2, 2016
Sold by
Referee Of Suffolk County
Bought by
Real Onion Llc
Purchase Details
Closed on
May 10, 2002
Sold by
Corrado Robert and Corrado Kim
Bought by
Corrado Kim
Home Financials for this Owner
Home Financials are based on the most recent Mortgage that was taken out on this home.
Original Mortgage
$146,000
Interest Rate
7%
Create a Home Valuation Report for This Property
The Home Valuation Report is an in-depth analysis detailing your home's value as well as a comparison with similar homes in the area
Home Values in the Area
Average Home Value in this Area
Purchase History
| Date | Buyer | Sale Price | Title Company |
|---|---|---|---|
| Chowdhury Anukul C | $265,000 | -- | |
| Chowdhury Anukul C | $265,000 | -- | |
| Chowdhury Anukul C | $265,000 | -- | |
| Real Onion Llc | $126,500 | None Available | |
| Real Onion Llc | $126,500 | None Available | |
| Corrado Kim | -- | -- | |
| Corrado Kim | -- | -- |
Source: Public Records
Mortgage History
| Date | Status | Borrower | Loan Amount |
|---|---|---|---|
| Open | Chowdhury Anukul C | $231,990 | |
| Closed | Chowdhury Anukul C | $231,990 | |
| Previous Owner | Corrado Kim | $146,000 | |
| Closed | Real Onion Llc | $0 |
Source: Public Records
Tax History Compared to Growth
Tax History
| Year | Tax Paid | Tax Assessment Tax Assessment Total Assessment is a certain percentage of the fair market value that is determined by local assessors to be the total taxable value of land and additions on the property. | Land | Improvement |
|---|---|---|---|---|
| 2024 | $8,640 | $29,500 | $8,400 | $21,100 |
| 2023 | $8,640 | $29,500 | $8,400 | $21,100 |
| 2022 | $6,258 | $29,500 | $8,400 | $21,100 |
| 2021 | $6,258 | $29,500 | $8,400 | $21,100 |
| 2020 | $8,075 | $29,500 | $8,400 | $21,100 |
| 2019 | $8,075 | $0 | $0 | $0 |
| 2018 | -- | $29,500 | $8,400 | $21,100 |
| 2017 | $6,796 | $25,350 | $8,400 | $16,950 |
| 2016 | $6,771 | $25,350 | $8,400 | $16,950 |
| 2015 | -- | $25,350 | $8,400 | $16,950 |
| 2014 | -- | $25,350 | $8,400 | $16,950 |
Source: Public Records
Map
Nearby Homes