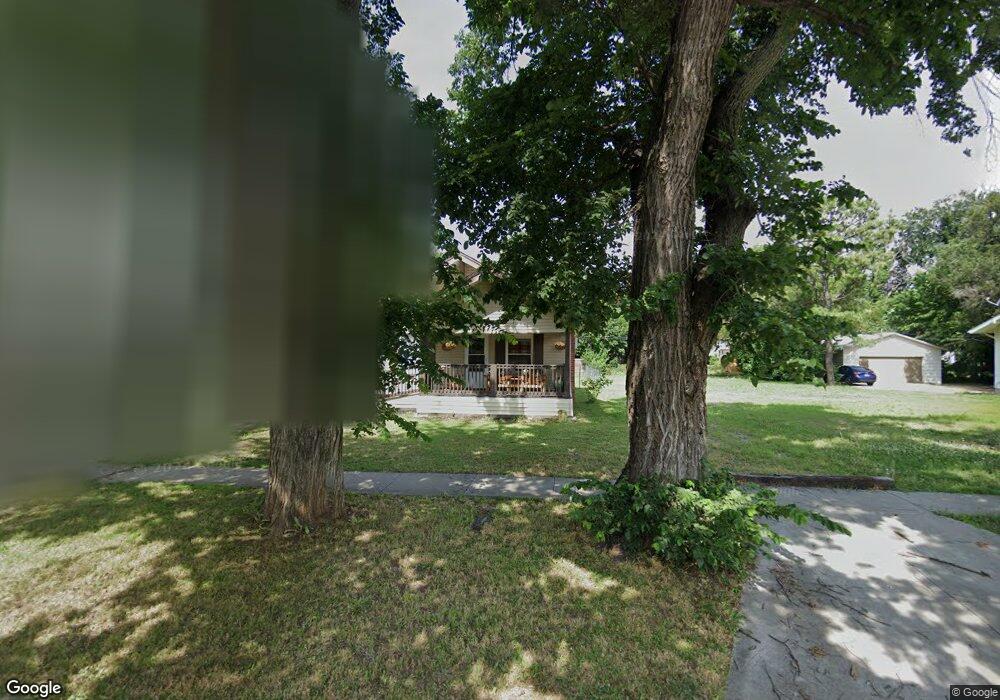
426 S Elm St Ponca City, OK 74601
Estimated Value: $54,000 - $73,000
2
Beds
1
Bath
1,060
Sq Ft
$61/Sq Ft
Est. Value
About This Home
This home is located at 426 S Elm St, Ponca City, OK 74601 and is currently estimated at $64,681, approximately $61 per square foot. 426 S Elm St is a home located in Kay County with nearby schools including Lincoln Elementary School, Ponca City West Middle School, and Ponca City East Middle School.
Ownership History
Date
Name
Owned For
Owner Type
Purchase Details
Closed on
Aug 30, 2023
Sold by
Northcutt Angie
Bought by
Northcutt Angie and Allison Pamela
Current Estimated Value
Purchase Details
Closed on
May 27, 2022
Sold by
R & J Rentals Llc
Bought by
R & J Home Rentals Llc
Purchase Details
Closed on
Feb 5, 2014
Sold by
Rak Investments Inc
Bought by
R & J Home Rentals Llc
Purchase Details
Closed on
Dec 31, 2013
Sold by
Epperly Monica
Bought by
Rak Investments Inc
Purchase Details
Closed on
Jul 26, 2007
Sold by
Rader Donald R
Bought by
Rader Donald R and Rader Della O
Create a Home Valuation Report for This Property
The Home Valuation Report is an in-depth analysis detailing your home's value as well as a comparison with similar homes in the area
Home Values in the Area
Average Home Value in this Area
Purchase History
| Date | Buyer | Sale Price | Title Company |
|---|---|---|---|
| Northcutt Angie | -- | None Listed On Document | |
| Northcutt Angie | -- | None Listed On Document | |
| R & J Home Rentals Llc | $46,000 | None Listed On Document | |
| R & J Home Rentals Llc | $24,900 | Stewart Escrow & Title | |
| Rak Investments Inc | $13,500 | Stewart Escrow & Title | |
| Rader Donald R | -- | -- |
Source: Public Records
Tax History Compared to Growth
Tax History
| Year | Tax Paid | Tax Assessment Tax Assessment Total Assessment is a certain percentage of the fair market value that is determined by local assessors to be the total taxable value of land and additions on the property. | Land | Improvement |
|---|---|---|---|---|
| 2024 | $646 | $6,820 | $339 | $6,481 |
| 2023 | $646 | $5,060 | $334 | $4,726 |
| 2022 | $271 | $2,849 | $339 | $2,510 |
| 2021 | $273 | $2,849 | $339 | $2,510 |
| 2020 | $269 | $2,837 | $339 | $2,498 |
| 2019 | $258 | $2,702 | $339 | $2,363 |
| 2018 | $263 | $2,713 | $339 | $2,374 |
| 2017 | $266 | $2,713 | $339 | $2,374 |
| 2016 | $269 | $2,715 | $339 | $2,376 |
| 2015 | $272 | $2,739 | $339 | $2,400 |
| 2014 | $256 | $2,619 | $308 | $2,311 |
Source: Public Records
Map
Nearby Homes