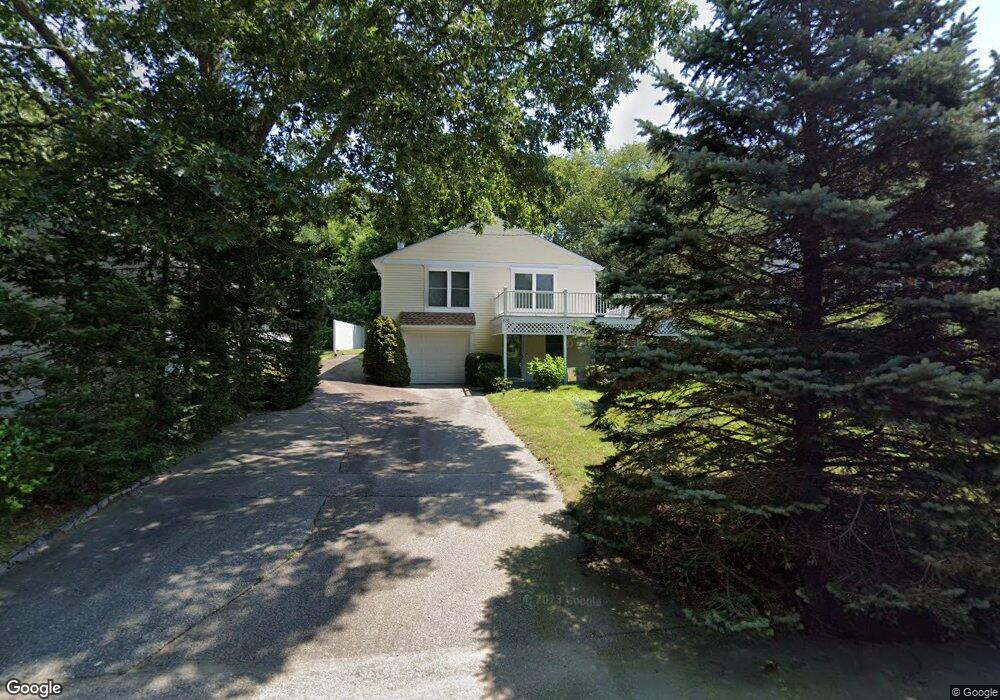
426 Sampan Ave Jamestown, RI 02835
West Reach Estates NeighborhoodEstimated Value: $723,635 - $761,000
2
Beds
2
Baths
1,080
Sq Ft
$688/Sq Ft
Est. Value
About This Home
This home is located at 426 Sampan Ave, Jamestown, RI 02835 and is currently estimated at $742,909, approximately $687 per square foot. 426 Sampan Ave is a home located in Newport County with nearby schools including Melrose Avenue School and Lawn Avenue School.
Ownership History
Date
Name
Owned For
Owner Type
Purchase Details
Closed on
Dec 9, 2003
Sold by
Salt Thomas and Salt Jana
Bought by
Caruso James and Caruso Wendy
Current Estimated Value
Home Financials for this Owner
Home Financials are based on the most recent Mortgage that was taken out on this home.
Original Mortgage
$115,000
Outstanding Balance
$53,847
Interest Rate
6.03%
Mortgage Type
Purchase Money Mortgage
Estimated Equity
$689,062
Purchase Details
Closed on
Sep 27, 1999
Sold by
Cocca Joanne and Rebello Ronald J
Bought by
Salt Thomas M and Salt Jana
Home Financials for this Owner
Home Financials are based on the most recent Mortgage that was taken out on this home.
Original Mortgage
$139,650
Interest Rate
8.1%
Purchase Details
Closed on
Mar 11, 1992
Sold by
Rosa Raymond
Bought by
Cocca Joanne
Home Financials for this Owner
Home Financials are based on the most recent Mortgage that was taken out on this home.
Original Mortgage
$105,600
Interest Rate
8.64%
Create a Home Valuation Report for This Property
The Home Valuation Report is an in-depth analysis detailing your home's value as well as a comparison with similar homes in the area
Home Values in the Area
Average Home Value in this Area
Purchase History
| Date | Buyer | Sale Price | Title Company |
|---|---|---|---|
| Caruso James | $340,000 | -- | |
| Salt Thomas M | $143,000 | -- | |
| Cocca Joanne | $132,000 | -- |
Source: Public Records
Mortgage History
| Date | Status | Borrower | Loan Amount |
|---|---|---|---|
| Open | Cocca Joanne | $115,000 | |
| Previous Owner | Cocca Joanne | $138,900 | |
| Previous Owner | Cocca Joanne | $139,650 | |
| Previous Owner | Cocca Joanne | $105,600 |
Source: Public Records
Tax History Compared to Growth
Tax History
| Year | Tax Paid | Tax Assessment Tax Assessment Total Assessment is a certain percentage of the fair market value that is determined by local assessors to be the total taxable value of land and additions on the property. | Land | Improvement |
|---|---|---|---|---|
| 2025 | $3,450 | $611,700 | $226,600 | $385,100 |
| 2024 | $3,371 | $470,200 | $171,700 | $298,500 |
| 2023 | $3,345 | $479,200 | $171,700 | $307,500 |
| 2022 | $3,254 | $479,200 | $171,700 | $307,500 |
| 2021 | $2,538 | $306,500 | $134,500 | $172,000 |
| 2020 | $2,473 | $306,500 | $134,500 | $172,000 |
| 2019 | $2,467 | $306,500 | $134,500 | $172,000 |
| 2018 | $2,478 | $280,000 | $120,700 | $159,300 |
| 2017 | $2,425 | $280,000 | $120,700 | $159,300 |
| 2016 | $2,402 | $280,000 | $120,700 | $159,300 |
| 2015 | $2,386 | $271,700 | $141,100 | $130,600 |
| 2014 | $2,377 | $271,700 | $141,100 | $130,600 |
Source: Public Records
Map
Nearby Homes
- 398 Sampan Ave
- 280 W Reach Dr
- 10 Columbia Ln
- 58 Dolphin St
- 31 Stanchion St
- 18 Collins Terrace
- 625 N Main Rd
- 174 Seaside Dr
- 50 Prospect Ave
- 94 Spindrift St
- 121 Seaside Dr
- 12 Easterly Way
- 0 Circuit Ave
- 21 Helm St
- 10 Coulter St
- 129 North Rd
- 65 Spring St
- 10 Highland Rd
- 16 Pennsylvania Ave
- 73 Oceanwoods Dr
- 432 Sampan Ave
- 412 Sampan Ave
- 421 Felucca Ave
- 440 Sampan Ave
- 429 Sampan Ave
- 431 Sampan Ave
- 413 Felucca Ave
- 425 Sampan Ave
- 437 Sampan Ave
- 409 Sampan Ave
- 447 Sampan Ave
- 449 Felucca Ave
- 409 Felucca Ave
- 430 Felucca Ave
- 402 Sampan Ave
- 454 Sampan Ave
- 420 Felucca Ave
- 428 Schooner Ave
- 412 Felucca Ave
- 426 Schooner Ave