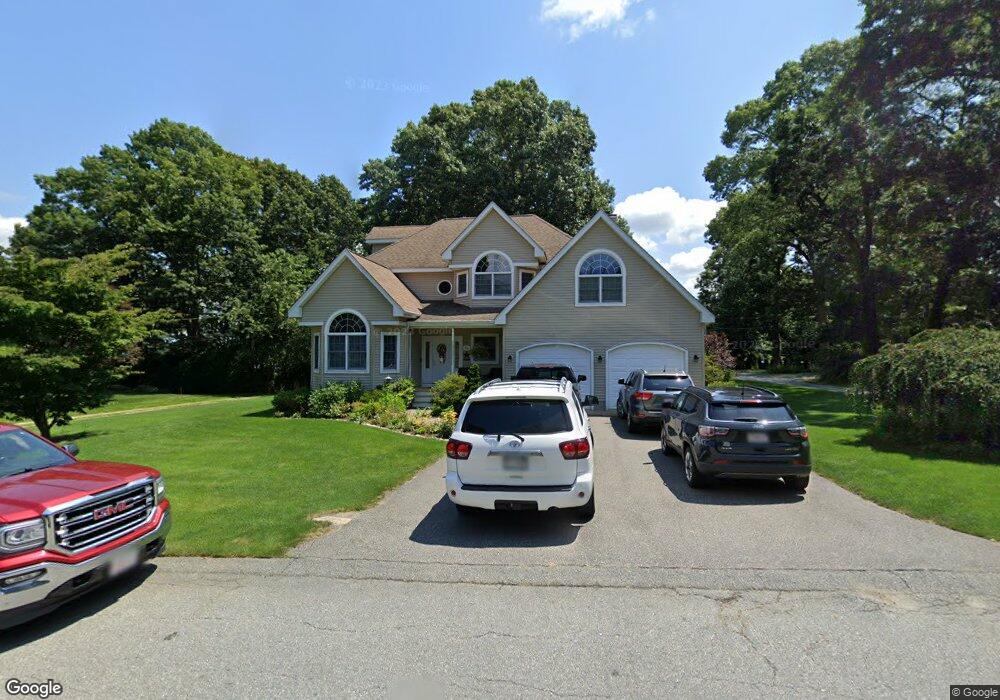
426 Sion St Fall River, MA 02721
Maplewood NeighborhoodEstimated Value: $607,000 - $711,000
3
Beds
3
Baths
2,428
Sq Ft
$265/Sq Ft
Est. Value
About This Home
This home is located at 426 Sion St, Fall River, MA 02721 and is currently estimated at $643,595, approximately $265 per square foot. 426 Sion St is a home located in Bristol County with nearby schools including Letourneau Elementary School, Matthew J. Kuss Middle School, and B M C Durfee High School.
Ownership History
Date
Name
Owned For
Owner Type
Purchase Details
Closed on
Jun 28, 2002
Sold by
Pacheco Robert C and Pacheco Donna M
Bought by
Resendes Kris J and Resendes Lynn A
Current Estimated Value
Home Financials for this Owner
Home Financials are based on the most recent Mortgage that was taken out on this home.
Original Mortgage
$190,000
Outstanding Balance
$81,743
Interest Rate
6.92%
Mortgage Type
Purchase Money Mortgage
Estimated Equity
$561,852
Purchase Details
Closed on
Aug 15, 1994
Sold by
Renaud Roger L and Deniger Doris
Bought by
Pacheco Robert C and Pacheco Donna M
Home Financials for this Owner
Home Financials are based on the most recent Mortgage that was taken out on this home.
Original Mortgage
$49,600
Interest Rate
8.52%
Mortgage Type
Purchase Money Mortgage
Create a Home Valuation Report for This Property
The Home Valuation Report is an in-depth analysis detailing your home's value as well as a comparison with similar homes in the area
Home Values in the Area
Average Home Value in this Area
Purchase History
| Date | Buyer | Sale Price | Title Company |
|---|---|---|---|
| Resendes Kris J | $70,000 | -- | |
| Pacheco Robert C | $68,000 | -- |
Source: Public Records
Mortgage History
| Date | Status | Borrower | Loan Amount |
|---|---|---|---|
| Open | Resendes Kris J | $190,000 | |
| Previous Owner | Pacheco Robert C | $49,600 |
Source: Public Records
Tax History
| Year | Tax Paid | Tax Assessment Tax Assessment Total Assessment is a certain percentage of the fair market value that is determined by local assessors to be the total taxable value of land and additions on the property. | Land | Improvement |
|---|---|---|---|---|
| 2025 | $6,375 | $556,800 | $138,200 | $418,600 |
| 2024 | $5,951 | $517,900 | $133,000 | $384,900 |
| 2023 | $6,320 | $515,100 | $126,500 | $388,600 |
| 2022 | $5,610 | $444,500 | $117,200 | $327,300 |
| 2021 | $5,876 | $424,900 | $116,900 | $308,000 |
| 2020 | $5,766 | $399,000 | $110,500 | $288,500 |
| 2019 | $5,615 | $385,100 | $108,400 | $276,700 |
| 2018 | $5,326 | $364,300 | $103,200 | $261,100 |
| 2017 | $5,041 | $360,100 | $103,200 | $256,900 |
| 2016 | $4,715 | $345,900 | $103,200 | $242,700 |
| 2015 | $5,007 | $382,800 | $96,500 | $286,300 |
| 2014 | $4,816 | $382,800 | $96,500 | $286,300 |
Source: Public Records
Map
Nearby Homes
- 0 Wood St
- 664 Norman St
- 0 Hancock St
- 1082 Hancock St
- 206 Songbird Ln
- 186 Spencer St
- 37 Bluejay St
- 84 Lark Ln
- 18 Mockingbird Ln
- 38 Hummingbird Ln
- 21 Nightingale Ln
- 3 Blackbird St
- 71 Blackbird St
- 495 Chicago St
- 0 Stafford Rd Unit 1393774
- 0 Sheldon St
- 59 Denver St
- 185 Stafford Rd
- 248 Jefferson St
- 250 Nelson St
Your Personal Tour Guide
Ask me questions while you tour the home.