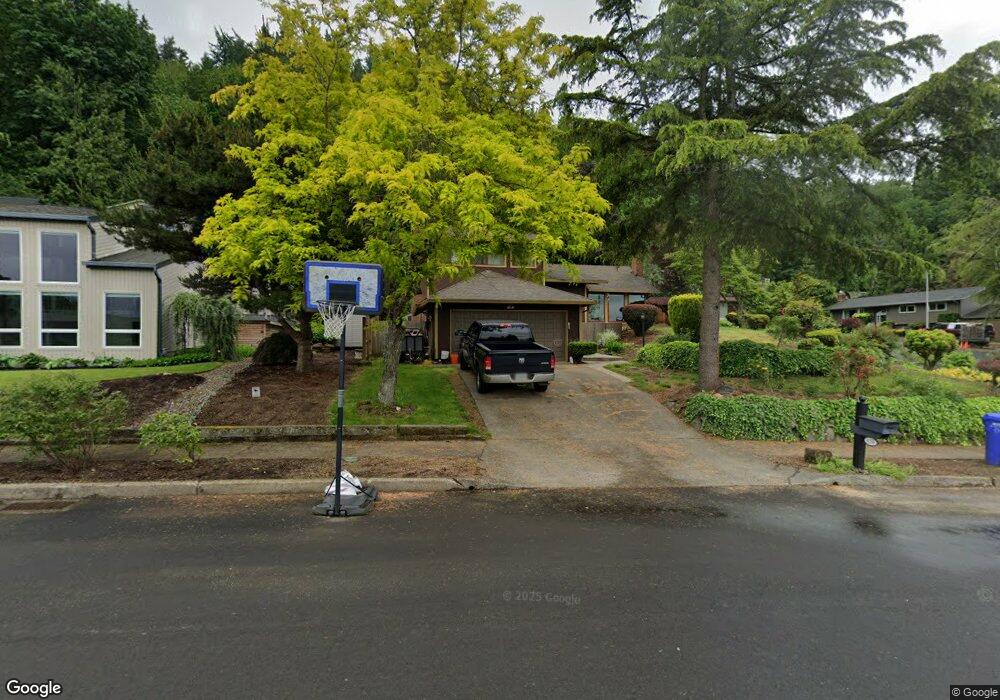
426 SW 7th St Gresham, OR 97080
Gresham Butte NeighborhoodEstimated Value: $506,000 - $585,000
4
Beds
3
Baths
2,099
Sq Ft
$261/Sq Ft
Est. Value
About This Home
This home is located at 426 SW 7th St, Gresham, OR 97080 and is currently estimated at $548,697, approximately $261 per square foot. 426 SW 7th St is a home located in Multnomah County with nearby schools including Dexter McCarty Middle School, Gresham High School, and Gresham Arthur Academy.
Ownership History
Date
Name
Owned For
Owner Type
Purchase Details
Closed on
Aug 28, 2012
Sold by
Jacobson Roy
Bought by
Knobbs Mitchell R and Knobbs Trisha L
Current Estimated Value
Home Financials for this Owner
Home Financials are based on the most recent Mortgage that was taken out on this home.
Original Mortgage
$199,900
Outstanding Balance
$136,807
Interest Rate
3.49%
Mortgage Type
New Conventional
Estimated Equity
$411,890
Purchase Details
Closed on
Sep 13, 2011
Sold by
Hughes Christopher W
Bought by
Jacobson Roy
Purchase Details
Closed on
Nov 27, 1998
Sold by
Hammond Rory R
Bought by
Hughes Christopher W and Hughes Dorothy M
Home Financials for this Owner
Home Financials are based on the most recent Mortgage that was taken out on this home.
Original Mortgage
$169,830
Interest Rate
6.69%
Mortgage Type
VA
Purchase Details
Closed on
May 11, 1995
Sold by
Rauch Joann
Bought by
Hammond Rory R
Create a Home Valuation Report for This Property
The Home Valuation Report is an in-depth analysis detailing your home's value as well as a comparison with similar homes in the area
Home Values in the Area
Average Home Value in this Area
Purchase History
| Date | Buyer | Sale Price | Title Company |
|---|---|---|---|
| Knobbs Mitchell R | $249,900 | First American | |
| Jacobson Roy | $175,000 | First American | |
| Hughes Christopher W | $166,500 | Ticor Title Insurance | |
| Hammond Rory R | -- | Fidelity National Title |
Source: Public Records
Mortgage History
| Date | Status | Borrower | Loan Amount |
|---|---|---|---|
| Open | Knobbs Mitchell R | $199,900 | |
| Previous Owner | Hughes Christopher W | $169,830 |
Source: Public Records
Tax History
| Year | Tax Paid | Tax Assessment Tax Assessment Total Assessment is a certain percentage of the fair market value that is determined by local assessors to be the total taxable value of land and additions on the property. | Land | Improvement |
|---|---|---|---|---|
| 2025 | $6,641 | $326,350 | -- | -- |
| 2024 | $6,357 | $316,850 | -- | -- |
| 2023 | $5,792 | $307,630 | $0 | $0 |
| 2022 | $5,630 | $298,670 | $0 | $0 |
| 2021 | $5,488 | $289,980 | $0 | $0 |
| 2020 | $5,164 | $281,540 | $0 | $0 |
| 2019 | $5,029 | $273,340 | $0 | $0 |
| 2018 | $4,795 | $265,380 | $0 | $0 |
| 2017 | $4,600 | $257,660 | $0 | $0 |
| 2016 | $4,056 | $250,160 | $0 | $0 |
Source: Public Records
Map
Nearby Homes
- 638 SW 7th St
- 625 SW Miller Ct
- 419 SW Day Ct
- 200 SW Florence Ave
- 55 SW Lovhar Dr
- 645 W Powell Blvd
- 159 SW Florence Ave Unit 64
- 159 SW Florence Ave
- 1333 SW 5th Place
- 0 SW Miller Ct Unit 470855683
- 1434 SW 5th Place
- 417 SE Roberts Ave
- 1113 W Powell Blvd
- 64 NW Florence Ave
- 1407 SE Beech Place
- 1175 SW Chastain Dr
- 317 SW Angeline Ave
- 511 SE 15th St
- 318 NE Roberts Ave Unit 308
- 420 SE Linden Ave
- 736 SW Norman Ct
- 749 SW Eastman Ave
- 510 SW 7th St
- 421 SW 7th St
- 433 SW 7th St
- 755 SW Norman Ct
- 737 SW Norman Ct
- 407 SW 7th St
- 690 SW Blaine Place
- 730 SW Eastman Ave
- 515 SW 7th St
- 710 SW Blaine Place
- 436 SW 6th St
- 720 SW Blaine Place
- 385 SW 7th St
- 466 SW 6th St
- 535 SW 7th St
- 486 SW 6th St
- 416 SW 6th St
Your Personal Tour Guide
Ask me questions while you tour the home.