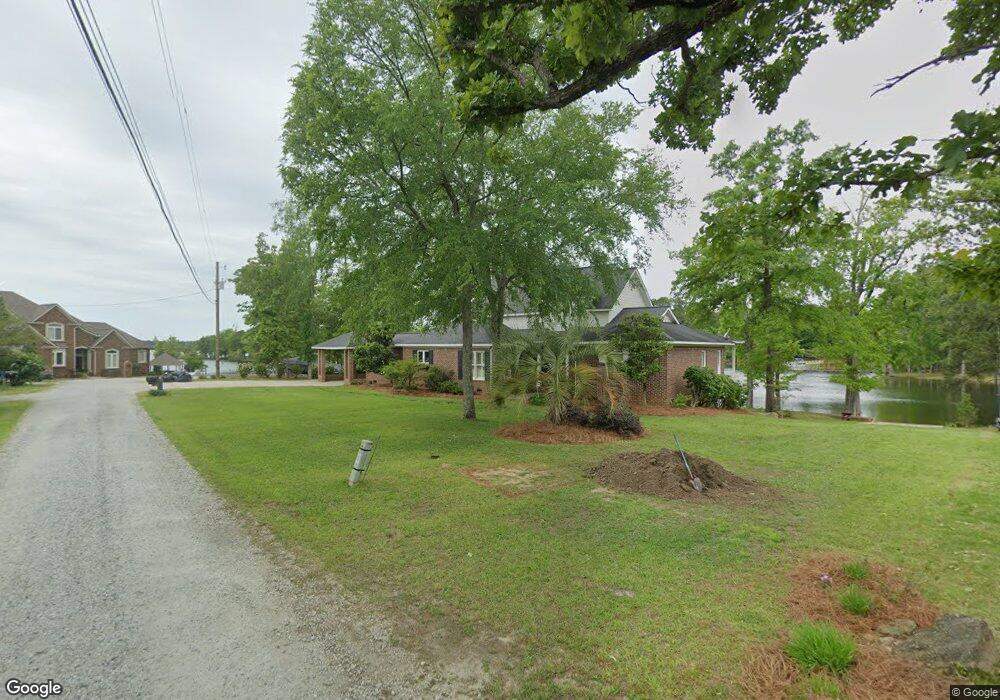
426 Three Point Rd Chapin, SC 29036
Estimated Value: $899,000 - $1,088,000
3
Beds
3
Baths
3,108
Sq Ft
$316/Sq Ft
Est. Value
About This Home
This home is located at 426 Three Point Rd, Chapin, SC 29036 and is currently estimated at $981,810, approximately $315 per square foot. 426 Three Point Rd is a home located in Lexington County with nearby schools including Lake Murray Elementary School, Chapin Intermediate, and Chapin High School.
Ownership History
Date
Name
Owned For
Owner Type
Purchase Details
Closed on
Aug 15, 2014
Sold by
Walrath Jean A
Bought by
Gravelle Patrick J and Gravelle Jeanne Marie W
Current Estimated Value
Home Financials for this Owner
Home Financials are based on the most recent Mortgage that was taken out on this home.
Original Mortgage
$265,000
Outstanding Balance
$202,739
Interest Rate
4.2%
Mortgage Type
Future Advance Clause Open End Mortgage
Estimated Equity
$779,071
Purchase Details
Closed on
Mar 23, 2006
Sold by
Walrath Robert F and Walrath Jean A
Bought by
Walrath Jean A and Jean A Walrath Trust Agreement
Home Financials for this Owner
Home Financials are based on the most recent Mortgage that was taken out on this home.
Original Mortgage
$175,000
Interest Rate
6.23%
Mortgage Type
New Conventional
Create a Home Valuation Report for This Property
The Home Valuation Report is an in-depth analysis detailing your home's value as well as a comparison with similar homes in the area
Home Values in the Area
Average Home Value in this Area
Purchase History
| Date | Buyer | Sale Price | Title Company |
|---|---|---|---|
| Gravelle Patrick J | $168,100 | -- | |
| Moseley R Scott | $465,000 | -- | |
| Walrath Jean A | -- | None Available | |
| Walrath Robert F | $625,000 | None Available |
Source: Public Records
Mortgage History
| Date | Status | Borrower | Loan Amount |
|---|---|---|---|
| Open | Moseley R Scott | $265,000 | |
| Closed | Gravelle Patrick J | $126,075 | |
| Previous Owner | Walrath Robert F | $175,000 |
Source: Public Records
Tax History Compared to Growth
Tax History
| Year | Tax Paid | Tax Assessment Tax Assessment Total Assessment is a certain percentage of the fair market value that is determined by local assessors to be the total taxable value of land and additions on the property. | Land | Improvement |
|---|---|---|---|---|
| 2024 | $3,271 | $21,381 | $9,600 | $11,781 |
| 2023 | $3,271 | $21,381 | $9,600 | $11,781 |
| 2022 | $3,295 | $21,381 | $9,600 | $11,781 |
| 2020 | $3,456 | $21,381 | $9,600 | $11,781 |
| 2019 | $3,059 | $18,600 | $8,064 | $10,536 |
| 2018 | $2,692 | $18,600 | $8,064 | $10,536 |
| 2017 | $2,623 | $18,600 | $8,064 | $10,536 |
| 2016 | $2,689 | $18,600 | $8,064 | $10,536 |
| 2014 | $2,463 | $19,517 | $8,510 | $11,007 |
| 2013 | -- | $19,520 | $8,510 | $11,010 |
Source: Public Records
Map
Nearby Homes
- 0 Three Point Rd
- lot 2 Saint Thomas Church Rd
- 132 Killian Point Cir
- 1108 Floyd Slice Ct
- 1060 Haymar Rd
- 315 Old Landing Ct
- 108 Killian Point Cir
- 1351 Tamarind Ln
- 1529 Garrett Ct
- 806 Bergenfield Ln
- 866 Bergenfield Ln
- 1778 Isle of Pines Dr
- 220 Old Cedar Point
- 3408 Wessinger Rd
- 668 Clipper Trail
- 660 Clipper Trail
- 339 Newberg Rd
- 251 Edgewood Dr
- 368 Frick Ct
- 123 Old Cedar Point
- 420 3 Point Rd
- 433 Three Point Rd
- 435 3 Point Rd
- 419 Three Point Rd
- 411 Three Point Rd
- 327 Saint Thomas Church Rd
- 323 Saint Thomas Church Rd
- 326 Three Point Rd
- 331 Saint Thomas Church Rd
- 304 Three Point Rd
- 331 Three Point Rd
- 0 3 Point Rd
- 337 Three Point Rd
- 305 Saint Thomas Church Rd
- 341 Saint Thomas Church Rd
- 328 Saint Thomas Church Rd
- 330 Saint Thomas Church Rd
- 504 Three Point Rd
- 347 Saint Thomas Church Rd
- 336 Saint Thomas Church Rd