Estimated Value: $362,000 - $391,000
3
Beds
1
Bath
901
Sq Ft
$412/Sq Ft
Est. Value
About This Home
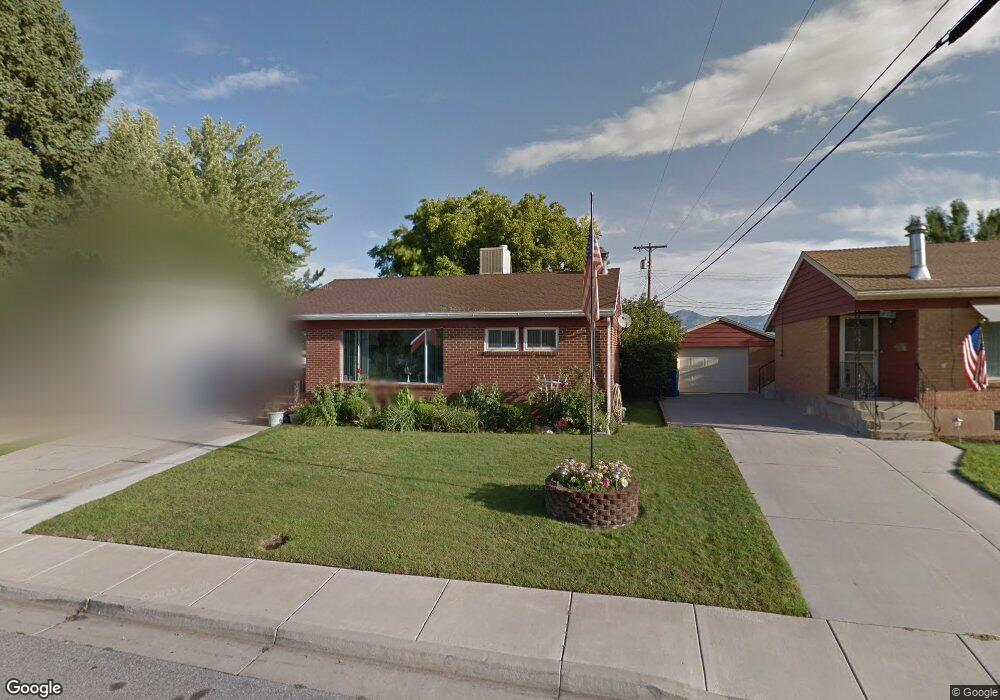
This home is located at 426 W 4775 S, Ogden, UT 84405 and is currently estimated at $371,495, approximately $412 per square foot. 426 W 4775 S is a home located in Weber County with nearby schools including Washington Terrace School, T.H. Bell Junior High School, and Bonneville High School.
Ownership History
Date
Name
Owned For
Owner Type
Purchase Details
Closed on
Jan 14, 2025
Sold by
Earl W Jackson & Thelma W Jackson Family and Jackson Thelma
Bought by
Earl W Jackson And Thelma W Jackson Family Li and Jackson
Current Estimated Value
Home Financials for this Owner
Home Financials are based on the most recent Mortgage that was taken out on this home.
Original Mortgage
$150,000
Outstanding Balance
$148,934
Interest Rate
6.69%
Mortgage Type
Credit Line Revolving
Estimated Equity
$222,561
Create a Home Valuation Report for This Property
The Home Valuation Report is an in-depth analysis detailing your home's value as well as a comparison with similar homes in the area
Home Values in the Area
Average Home Value in this Area
Purchase History
| Date | Buyer | Sale Price | Title Company |
|---|---|---|---|
| Earl W Jackson And Thelma W Jackson Family Li | -- | First American Title |
Source: Public Records
Mortgage History
| Date | Status | Borrower | Loan Amount |
|---|---|---|---|
| Open | Earl W Jackson And Thelma W Jackson Family Li | $150,000 |
Source: Public Records
Tax History
| Year | Tax Paid | Tax Assessment Tax Assessment Total Assessment is a certain percentage of the fair market value that is determined by local assessors to be the total taxable value of land and additions on the property. | Land | Improvement |
|---|---|---|---|---|
| 2025 | $2,448 | $360,136 | $107,501 | $252,635 |
| 2024 | $1,246 | $191,949 | $59,125 | $132,824 |
| 2023 | $974 | $182,600 | $59,557 | $123,043 |
| 2022 | $2,332 | $200,750 | $56,893 | $143,857 |
| 2021 | $1,793 | $247,000 | $53,731 | $193,269 |
| 2020 | $1,760 | $222,000 | $44,011 | $177,989 |
| 2019 | $1,678 | $195,000 | $44,011 | $150,989 |
| 2018 | $1,475 | $166,000 | $44,011 | $121,989 |
| 2017 | $487 | $141,000 | $29,020 | $111,980 |
| 2016 | $433 | $66,598 | $16,232 | $50,366 |
| 2015 | $1,213 | $66,662 | $16,232 | $50,430 |
| 2014 | $409 | $62,633 | $16,232 | $46,401 |
Source: Public Records
Map
Nearby Homes
Your Personal Tour Guide
Ask me questions while you tour the home.