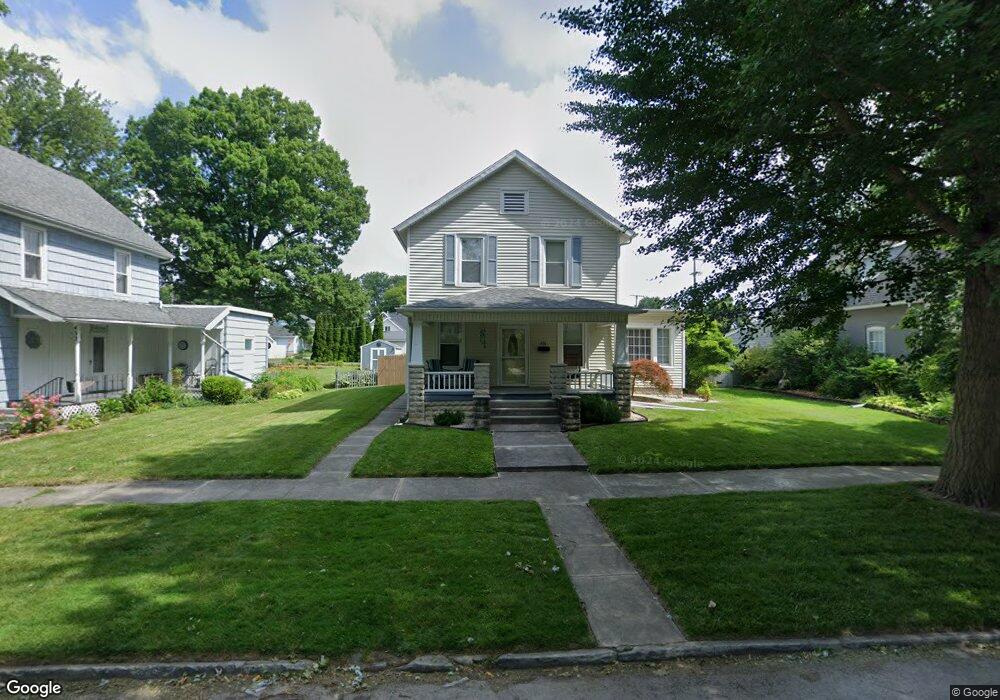
426 W Fremont St Fostoria, OH 44830
Estimated Value: $126,000 - $147,610
4
Beds
2
Baths
1,808
Sq Ft
$76/Sq Ft
Est. Value
About This Home
This home is located at 426 W Fremont St, Fostoria, OH 44830 and is currently estimated at $136,653, approximately $75 per square foot. 426 W Fremont St is a home located in Seneca County with nearby schools including Fostoria Intermediate Elementary School and Fostoria Junior/Senior High School.
Ownership History
Date
Name
Owned For
Owner Type
Purchase Details
Closed on
Jun 27, 2007
Sold by
Fannie Mae
Bought by
Kindle Randy
Current Estimated Value
Home Financials for this Owner
Home Financials are based on the most recent Mortgage that was taken out on this home.
Original Mortgage
$62,500
Outstanding Balance
$38,901
Interest Rate
6.42%
Mortgage Type
Purchase Money Mortgage
Estimated Equity
$97,752
Purchase Details
Closed on
Feb 1, 2007
Sold by
Kimble James and Central Mortgage Company
Bought by
Fannie Mae and Federal National Mortgage Association
Purchase Details
Closed on
Nov 12, 2003
Sold by
Kimble James
Bought by
Kimble James
Purchase Details
Closed on
Jun 5, 2002
Sold by
Meridian Mobility
Bought by
Kimble James
Purchase Details
Closed on
Aug 2, 1994
Sold by
Wade Minnie
Bought by
Lori L Gee
Create a Home Valuation Report for This Property
The Home Valuation Report is an in-depth analysis detailing your home's value as well as a comparison with similar homes in the area
Home Values in the Area
Average Home Value in this Area
Purchase History
| Date | Buyer | Sale Price | Title Company |
|---|---|---|---|
| Kindle Randy | $62,500 | Hold For Louisvile Title | |
| Fannie Mae | $44,667 | None Available | |
| Kimble James | $49,300 | -- | |
| Kimble James | $90,000 | -- | |
| Lori L Gee | $33,500 | -- |
Source: Public Records
Mortgage History
| Date | Status | Borrower | Loan Amount |
|---|---|---|---|
| Open | Kindle Randy | $62,500 |
Source: Public Records
Tax History Compared to Growth
Tax History
| Year | Tax Paid | Tax Assessment Tax Assessment Total Assessment is a certain percentage of the fair market value that is determined by local assessors to be the total taxable value of land and additions on the property. | Land | Improvement |
|---|---|---|---|---|
| 2024 | $2,036 | $40,420 | $4,060 | $36,360 |
| 2023 | $2,040 | $40,420 | $4,060 | $36,360 |
| 2022 | $1,808 | $31,900 | $3,500 | $28,400 |
| 2021 | $1,847 | $31,900 | $3,500 | $28,400 |
| 2020 | $1,856 | $31,900 | $3,504 | $28,396 |
| 2019 | $1,762 | $30,048 | $3,381 | $26,667 |
| 2018 | $1,796 | $30,048 | $3,381 | $26,667 |
| 2017 | $1,620 | $30,048 | $3,381 | $26,667 |
| 2016 | $1,470 | $27,549 | $3,525 | $24,024 |
| 2015 | $1,445 | $27,549 | $3,525 | $24,024 |
| 2014 | $1,375 | $27,549 | $3,525 | $24,024 |
| 2013 | $1,607 | $29,751 | $3,833 | $25,918 |
Source: Public Records
Map
Nearby Homes
- 520 N Union St
- 203 N Union St
- 509 College Ave
- 723 N Union St
- 211 Summit St
- 348 W South St
- 603 N Vine St
- 351 W South St
- 0 W South Route 12
- 633 Maple St
- 931 N Union St
- 540 N Poplar St
- 321 Mcdougal St
- 892 N Countyline St
- 900 N Countyline St
- 435 Park Ave
- 901 Central Ave
- 207 W Culbertson St
- 412 E Center St
- 442 Union Ct
- 420 W Fremont St
- 432 W Fremont St
- 438 W Fremont St
- 414 W Fremont St
- 441-441 1/2 Fremont
- 446 Fremont Dr
- 327 W High St
- 321 W High St
- 448 Fremont Dr
- 331 W High St
- 415 N Union St
- 401 N Union St
- 339 W High St
- 427 W Fremont St
- 421 W Fremont St
- 415 W Fremont St
- 417 N Union St
- 413 W Fremont St
- 435 W Fremont St
- 452 Fremont Dr