426 W Minota St Springfield, MO 65807
Fassnight NeighborhoodEstimated Value: $161,000 - $185,000
2
Beds
1
Bath
1,181
Sq Ft
$149/Sq Ft
Est. Value
About This Home
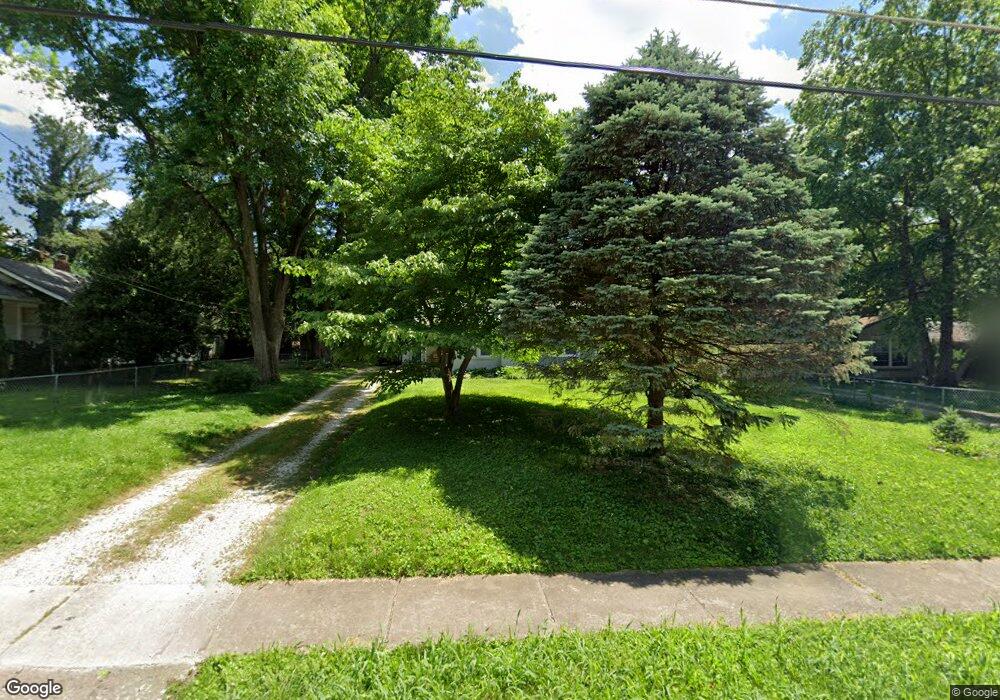
This home is located at 426 W Minota St, Springfield, MO 65807 and is currently estimated at $175,829, approximately $148 per square foot. 426 W Minota St is a home located in Greene County with nearby schools including Sunshine Elementary School, Jarrett Middle, and Parkview High School.
Ownership History
Date
Name
Owned For
Owner Type
Purchase Details
Closed on
Feb 28, 2025
Sold by
Ward Alysa Dawn and Holt Alysa Dawn
Bought by
Holt Marra M and Cessna Deegan P
Current Estimated Value
Home Financials for this Owner
Home Financials are based on the most recent Mortgage that was taken out on this home.
Original Mortgage
$116,800
Outstanding Balance
$116,222
Interest Rate
7.04%
Mortgage Type
New Conventional
Estimated Equity
$59,607
Purchase Details
Closed on
Jun 3, 2016
Sold by
Kg Real Estate Investments Llc
Bought by
Ward Alysa Dawn
Home Financials for this Owner
Home Financials are based on the most recent Mortgage that was taken out on this home.
Original Mortgage
$71,600
Interest Rate
3.59%
Mortgage Type
New Conventional
Purchase Details
Closed on
Jun 30, 2015
Sold by
Firefly Opportunities Llc
Bought by
Kg Real Estate Investments Llc
Purchase Details
Closed on
Dec 15, 2014
Sold by
Ryan Jean M
Bought by
Firefly Opportunities Llc
Purchase Details
Closed on
Oct 10, 2014
Sold by
Tevebaugh Cisely Geree
Bought by
Ryan Jean and Estate Of Linda S Tevebaugh
Create a Home Valuation Report for This Property
The Home Valuation Report is an in-depth analysis detailing your home's value as well as a comparison with similar homes in the area
Home Values in the Area
Average Home Value in this Area
Purchase History
| Date | Buyer | Sale Price | Title Company |
|---|---|---|---|
| Holt Marra M | -- | None Listed On Document | |
| Ward Alysa Dawn | -- | None Available | |
| Kg Real Estate Investments Llc | -- | Meridian Title & Closing Co | |
| Firefly Opportunities Llc | $29,500 | None Available | |
| Ryan Jean | -- | None Available |
Source: Public Records
Mortgage History
| Date | Status | Borrower | Loan Amount |
|---|---|---|---|
| Open | Holt Marra M | $116,800 | |
| Previous Owner | Ward Alysa Dawn | $71,600 |
Source: Public Records
Tax History
| Year | Tax Paid | Tax Assessment Tax Assessment Total Assessment is a certain percentage of the fair market value that is determined by local assessors to be the total taxable value of land and additions on the property. | Land | Improvement |
|---|---|---|---|---|
| 2025 | $1,149 | $23,070 | $5,950 | $17,120 |
| 2024 | $996 | $18,560 | $2,850 | $15,710 |
| 2023 | $990 | $18,560 | $2,850 | $15,710 |
| 2022 | $934 | $17,100 | $2,850 | $14,250 |
| 2021 | $934 | $17,100 | $2,850 | $14,250 |
| 2020 | $625 | $10,940 | $2,850 | $8,090 |
| 2019 | $607 | $10,940 | $2,850 | $8,090 |
| 2018 | $870 | $15,680 | $2,280 | $13,400 |
| 2017 | $861 | $4,660 | $2,280 | $2,380 |
| 2016 | $255 | $4,660 | $2,280 | $2,380 |
| 2015 | $253 | $4,660 | $2,280 | $2,380 |
| 2014 | $249 | $4,560 | $2,280 | $2,280 |
Source: Public Records
Map
Nearby Homes
- 437 W Minota St
- 1452 South Ave
- 810 W Minota St
- 816 W Ildereen St
- 901 W Portland St
- 1460 S Jefferson Ave
- 424 E Meadowmere St
- 1026 W Portland St
- 1516 S Kimbrough Ave
- 1337 S Kimbrough Ave
- 1834 S Jefferson Ave
- 1342 S Kimbrough Ave
- 517 E Catalpa St
- 1941 S Sagamont Ave
- 630 E Stanford St
- 206 E Cherokee St
- 307 W McGee St
- 620 E Sunshine St
- 1825 S Weaver Ave
- 306 W McGee St
- 420 W Minota St
- 434 W Minota St
- 416 W Minota St
- 438 W Minota St
- 433 W Portland St
- 425 W Portland St
- 415 W Portland St
- 500 W Minota St
- 431 W Minolta St
- 439 W Portland St
- 427 W Minota St
- 431 W Minota St
- 1561 S Campbell Ave
- 1545 S Campbell Ave
- 1551 S Campbell Ave
- 421 W Minota St
- 445 W Portland St
- 506 W Minota St
- 441 W Minota St
- 413 W Minota St
Your Personal Tour Guide
Ask me questions while you tour the home.