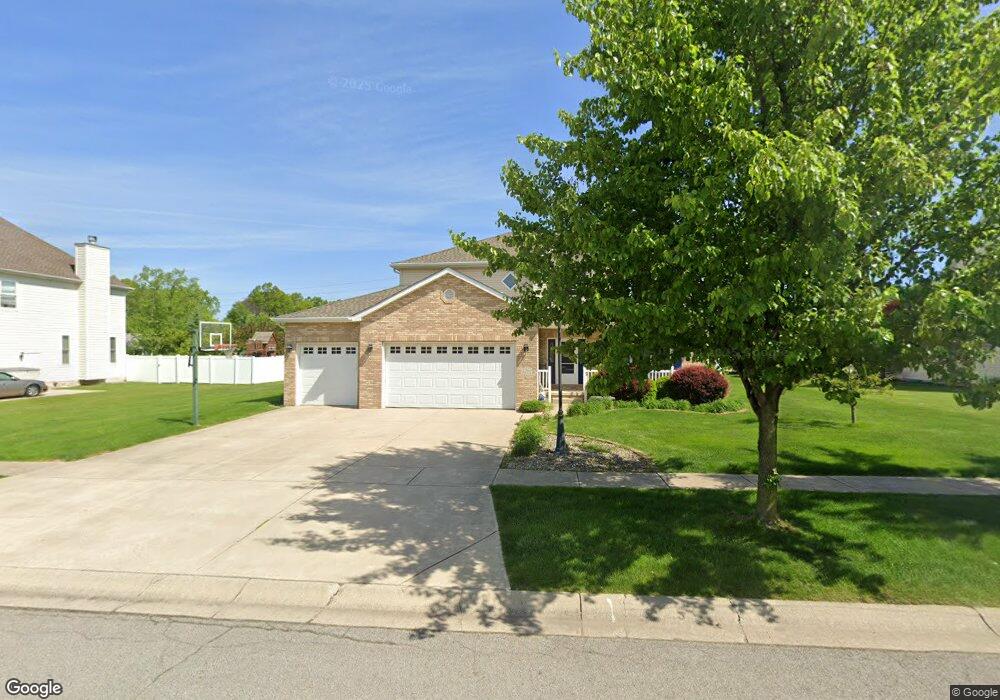
4260 Abercrombie Dr Chesterton, IN 46304
Estimated Value: $385,000 - $507,000
4
Beds
3
Baths
2,564
Sq Ft
$180/Sq Ft
Est. Value
About This Home
This home is located at 4260 Abercrombie Dr, Chesterton, IN 46304 and is currently estimated at $460,751, approximately $179 per square foot. 4260 Abercrombie Dr is a home located in Porter County with nearby schools including Liberty Elementary School, Liberty Intermediate School, and Chesterton Middle School.
Ownership History
Date
Name
Owned For
Owner Type
Purchase Details
Closed on
Dec 2, 2005
Sold by
Blount Richard S and Blount Machelle M
Bought by
Gilyan Phillip D and Gilyan Regina R
Current Estimated Value
Home Financials for this Owner
Home Financials are based on the most recent Mortgage that was taken out on this home.
Original Mortgage
$233,520
Outstanding Balance
$131,199
Interest Rate
6.36%
Mortgage Type
Fannie Mae Freddie Mac
Estimated Equity
$329,552
Purchase Details
Closed on
Jan 20, 2005
Sold by
Northwest Indiana Homes Builders Inc
Bought by
Blount Richard S and Blount Machelle M
Home Financials for this Owner
Home Financials are based on the most recent Mortgage that was taken out on this home.
Original Mortgage
$236,000
Interest Rate
5.75%
Mortgage Type
Fannie Mae Freddie Mac
Create a Home Valuation Report for This Property
The Home Valuation Report is an in-depth analysis detailing your home's value as well as a comparison with similar homes in the area
Home Values in the Area
Average Home Value in this Area
Purchase History
| Date | Buyer | Sale Price | Title Company |
|---|---|---|---|
| Gilyan Phillip D | -- | Ticor Title Insurance | |
| Blount Richard S | -- | Ticor Title Ins |
Source: Public Records
Mortgage History
| Date | Status | Borrower | Loan Amount |
|---|---|---|---|
| Open | Gilyan Phillip D | $233,520 | |
| Previous Owner | Blount Richard S | $236,000 |
Source: Public Records
Tax History Compared to Growth
Tax History
| Year | Tax Paid | Tax Assessment Tax Assessment Total Assessment is a certain percentage of the fair market value that is determined by local assessors to be the total taxable value of land and additions on the property. | Land | Improvement |
|---|---|---|---|---|
| 2024 | $4,846 | $431,400 | $57,400 | $374,000 |
| 2023 | $4,155 | $421,900 | $54,500 | $367,400 |
| 2022 | $4,135 | $368,000 | $54,500 | $313,500 |
| 2021 | $3,889 | $344,700 | $54,500 | $290,200 |
| 2020 | $3,640 | $322,900 | $47,500 | $275,400 |
| 2019 | $3,478 | $308,700 | $47,500 | $261,200 |
| 2018 | $3,347 | $297,300 | $47,500 | $249,800 |
| 2017 | $3,402 | $302,100 | $47,500 | $254,600 |
| 2016 | $3,532 | $313,500 | $48,000 | $265,500 |
| 2014 | $3,327 | $298,300 | $45,000 | $253,300 |
| 2013 | -- | $286,900 | $46,000 | $240,900 |
Source: Public Records
Map
Nearby Homes
- 2513 Springdale St
- 2472 Springdale St
- 2141 Larchwood Ave
- 2131 Pepperbush Ave
- 0 St Rd 149 Unit NRA824925
- 1461 Eagle St
- 3525 Drivers Way
- 237 Cessna Dr
- 0-TBD Lenburg Rd
- TBD Lenburg Rd
- V/L U S 20
- 283 Melton Rd
- The Duneland Plan at Village in Burns Harbor
- 2375 Arrow St
- 1151 Burns Blvd
- 0 Burns Blvd
- 1138 Weaver Way
- 1136 Weaver Way
- 1162 Chesterfield Ave
- 357 Melton Rd
- 4240 Abercrombie Dr
- 4290 Abercrombie Dr
- 4271 Abercrombie Dr
- 4251 Abercrombie Dr
- 4220 Abercrombie Dr
- 4291 Abercrombie Dr
- 2351 Westwood Ln
- 4231 Abercrombie Dr
- 2342 Larchwood Ave
- 4261 Burlwood Dr
- 2402 Westwood Ln S
- 4221 Abercrombie Dr
- 2410 Westwood Ln S
- 2451 Westwood Ln S
- 2341 Westwood Ln
- 4241 Burlwood Dr
- 2502 Aeropostale Dr
- 2420 Westwood Ln S
- 4202 Abercrombie Dr
- 2352 Westwood Ln