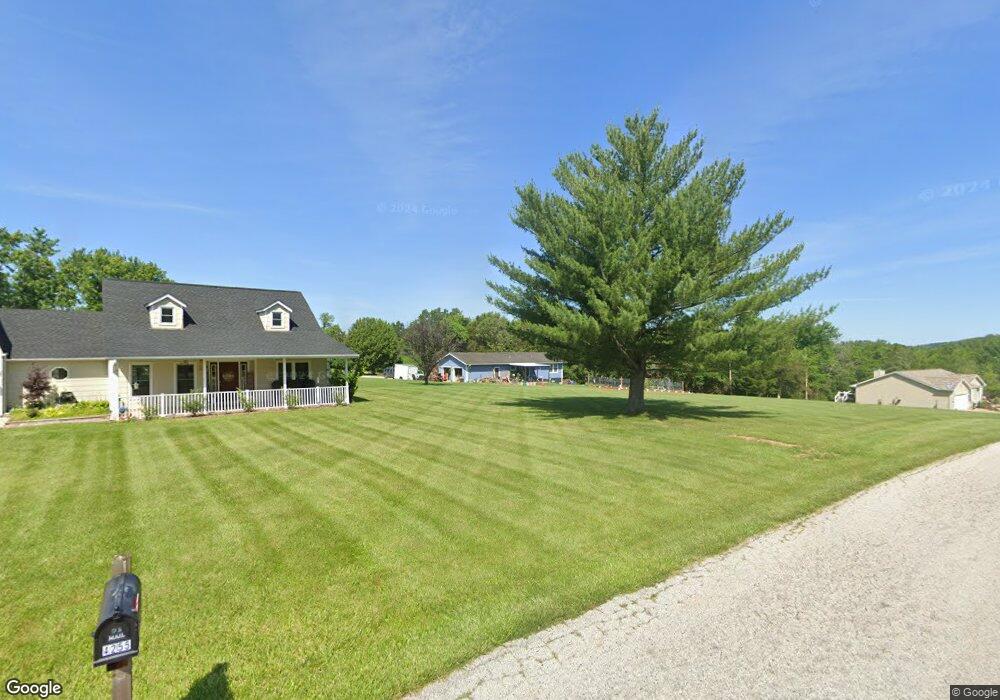
4260 Fernwood Cir House Springs, MO 63051
Estimated Value: $197,000 - $249,000
3
Beds
2
Baths
988
Sq Ft
$234/Sq Ft
Est. Value
About This Home
This home is located at 4260 Fernwood Cir, House Springs, MO 63051 and is currently estimated at $231,320, approximately $234 per square foot. 4260 Fernwood Cir is a home located in Jefferson County with nearby schools including Northwest High School and St. Anthony School.
Ownership History
Date
Name
Owned For
Owner Type
Purchase Details
Closed on
Apr 2, 2008
Sold by
Nationstar Mortgage Llc
Bought by
Logue Gregg L and Logue Lori Ann
Current Estimated Value
Home Financials for this Owner
Home Financials are based on the most recent Mortgage that was taken out on this home.
Original Mortgage
$128,981
Outstanding Balance
$81,149
Interest Rate
5.84%
Mortgage Type
FHA
Estimated Equity
$150,171
Purchase Details
Closed on
Jan 3, 2008
Sold by
Stephens Mark A and Stephens Stacy Lynette
Bought by
Nationstar Mortgage Llc
Purchase Details
Closed on
Sep 22, 2004
Sold by
Stephens Mark A and Stephens Stacy Lynette
Bought by
Stephens Mark A and Stephens Stacy Lynette
Home Financials for this Owner
Home Financials are based on the most recent Mortgage that was taken out on this home.
Original Mortgage
$162,000
Interest Rate
7.99%
Mortgage Type
New Conventional
Purchase Details
Closed on
Feb 20, 1998
Sold by
Purvines Tommy L and Purvines Deborah
Bought by
Stephens Mark A and Stephens Amy Jo
Home Financials for this Owner
Home Financials are based on the most recent Mortgage that was taken out on this home.
Original Mortgage
$93,101
Interest Rate
6.91%
Mortgage Type
FHA
Create a Home Valuation Report for This Property
The Home Valuation Report is an in-depth analysis detailing your home's value as well as a comparison with similar homes in the area
Home Values in the Area
Average Home Value in this Area
Purchase History
| Date | Buyer | Sale Price | Title Company |
|---|---|---|---|
| Logue Gregg L | -- | Continental Title | |
| Nationstar Mortgage Llc | $127,500 | None Available | |
| Stephens Mark A | -- | Northwest Title & Escrow | |
| Stephens Mark A | -- | -- |
Source: Public Records
Mortgage History
| Date | Status | Borrower | Loan Amount |
|---|---|---|---|
| Open | Logue Gregg L | $128,981 | |
| Previous Owner | Stephens Mark A | $162,000 | |
| Previous Owner | Stephens Mark A | $93,101 |
Source: Public Records
Tax History Compared to Growth
Tax History
| Year | Tax Paid | Tax Assessment Tax Assessment Total Assessment is a certain percentage of the fair market value that is determined by local assessors to be the total taxable value of land and additions on the property. | Land | Improvement |
|---|---|---|---|---|
| 2025 | $1,503 | $22,700 | $2,500 | $20,200 |
| 2024 | $1,503 | $20,900 | $2,500 | $18,400 |
| 2023 | $1,503 | $20,900 | $2,500 | $18,400 |
| 2022 | $1,496 | $20,900 | $2,500 | $18,400 |
| 2021 | $1,484 | $20,900 | $2,500 | $18,400 |
| 2020 | $1,365 | $18,700 | $2,100 | $16,600 |
| 2019 | $1,364 | $18,700 | $2,100 | $16,600 |
| 2018 | $1,379 | $18,700 | $2,100 | $16,600 |
| 2017 | $1,259 | $18,700 | $2,100 | $16,600 |
| 2016 | $1,193 | $17,700 | $2,500 | $15,200 |
| 2015 | $1,200 | $17,700 | $2,500 | $15,200 |
| 2013 | -- | $17,300 | $2,500 | $14,800 |
Source: Public Records
Map
Nearby Homes
- 0 Fernwood Cir
- 0 Fernwood Cir
- 0 Lot 45fernwood
- 0 Lot 40 & 41 Fernwood Unit 21026109
- 0 Holly Place
- 0 Lots 6 Cedar Dr
- 5975 Ridge Dr
- 0 Fernwood Dr
- 5919 Brookside Place
- 5916 Brookside Place
- 0 Lots 10 & 11 Hillcrest Dr Unit 21025129
- 6026 Grandview Rd
- 4138 Elizabeth Dr
- 2 Aspen II at Bear Ridge
- 5899 Midridge Dr
- 2 Berwick at Bear Ridge
- 4343 Bear Ridge Dr
- 5649 Sun Bear Dr
- 1052 Black Bear Dr
- 1044 Black Bear Dr
- 4233 Manor Crest Dr
- 4255 Manor Crest Dr
- 5919 Holly Place
- 4252 Manor Crest Dr
- 5889 Parkway Dr
- 5912 Holly Place
- 5908 Holly Place
- 4268 Manor Crest Dr
- 4283 Manor Crest Dr
- 4214 Manor Crest Dr
- 0 Lots 6 High Ridge Manor
- 0 Lots 3 & 4 High Ridge Manor
- 5875 Parkway Dr
- 4285 Manor Crest Dr
- 4180 Jannie Dr Unit 4180
- 4300 Hillcrest Dr
- 0 Hillcrest Dr
- 0 Hillcrest Dr
- 5967 Ridge Dr
- 4301 Fernwood Dr