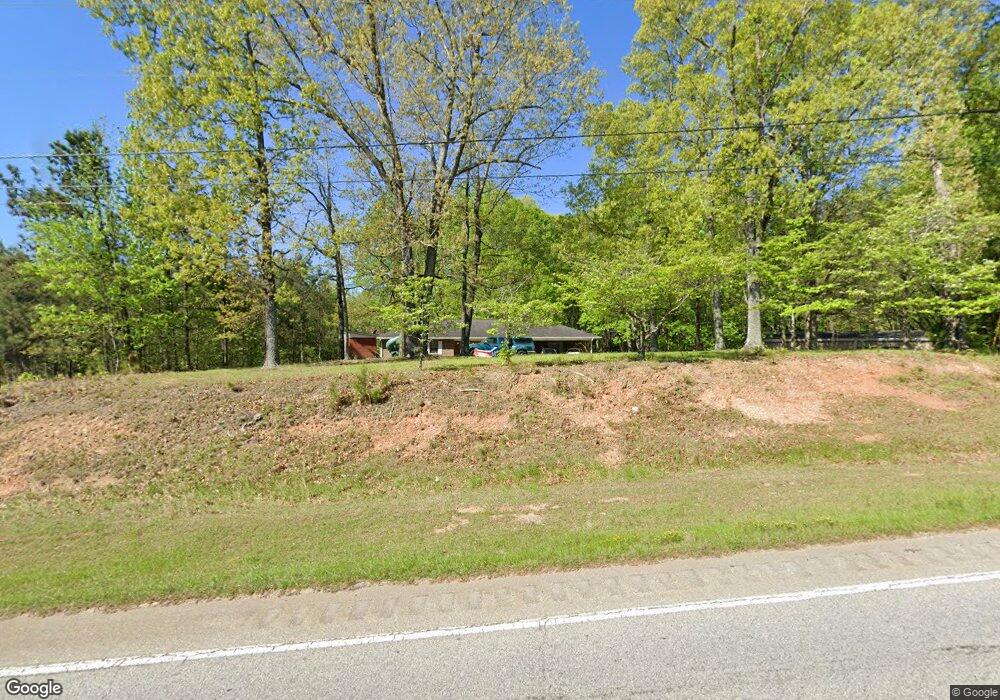
4260 N Highway 27 Carrollton, GA 30117
Estimated Value: $271,397 - $309,000
3
Beds
2
Baths
3,516
Sq Ft
$84/Sq Ft
Est. Value
About This Home
This home is located at 4260 N Highway 27, Carrollton, GA 30117 and is currently estimated at $294,849, approximately $83 per square foot. 4260 N Highway 27 is a home located in Carroll County with nearby schools including Mt. Zion Elementary School, Mt. Zion Middle School, and Mt. Zion High School.
Ownership History
Date
Name
Owned For
Owner Type
Purchase Details
Closed on
Apr 11, 2016
Sold by
Pettit Jason T
Bought by
Pettit Jason T and Pettit Heather M
Current Estimated Value
Home Financials for this Owner
Home Financials are based on the most recent Mortgage that was taken out on this home.
Original Mortgage
$123,393
Outstanding Balance
$98,028
Interest Rate
3.68%
Mortgage Type
New Conventional
Estimated Equity
$196,821
Purchase Details
Closed on
Sep 25, 2014
Sold by
Akin P T
Bought by
Recupido Kimberly and Emory Amber
Home Financials for this Owner
Home Financials are based on the most recent Mortgage that was taken out on this home.
Original Mortgage
$48,000
Interest Rate
4.16%
Mortgage Type
New Conventional
Purchase Details
Closed on
Jul 3, 1981
Bought by
Akin P N
Purchase Details
Closed on
Apr 8, 1947
Sold by
Wilson Mainon L and Wilson Lodric
Bought by
Akin P N
Create a Home Valuation Report for This Property
The Home Valuation Report is an in-depth analysis detailing your home's value as well as a comparison with similar homes in the area
Home Values in the Area
Average Home Value in this Area
Purchase History
| Date | Buyer | Sale Price | Title Company |
|---|---|---|---|
| Pettit Jason T | -- | -- | |
| Pattit Jason T | $120,000 | -- | |
| Recupido Kimberly | $35,000 | -- | |
| Emory Amber | $35,000 | -- | |
| Akin P N | -- | -- | |
| Akin P N | $3,400 | -- |
Source: Public Records
Mortgage History
| Date | Status | Borrower | Loan Amount |
|---|---|---|---|
| Open | Pattit Jason T | $123,393 | |
| Closed | Pettit Jason T | $123,393 | |
| Previous Owner | Emory Amber | $48,000 |
Source: Public Records
Tax History Compared to Growth
Tax History
| Year | Tax Paid | Tax Assessment Tax Assessment Total Assessment is a certain percentage of the fair market value that is determined by local assessors to be the total taxable value of land and additions on the property. | Land | Improvement |
|---|---|---|---|---|
| 2024 | $2,469 | $109,120 | $10,755 | $98,365 |
| 2023 | $2,469 | $98,527 | $8,604 | $89,923 |
| 2022 | $1,891 | $75,396 | $3,208 | $72,188 |
| 2021 | $1,667 | $65,026 | $2,566 | $62,460 |
| 2020 | $1,479 | $57,618 | $2,333 | $55,285 |
| 2019 | $1,398 | $54,013 | $2,333 | $51,680 |
| 2018 | $1,269 | $48,316 | $2,028 | $46,288 |
| 2017 | $1,164 | $48,316 | $2,028 | $46,288 |
| 2016 | $1,273 | $48,316 | $2,028 | $46,288 |
| 2015 | $1,315 | $47,032 | $3,312 | $43,721 |
| 2014 | $1,396 | $49,716 | $5,740 | $43,976 |
Source: Public Records
Map
Nearby Homes
- 14 Cole Lake Rd
- 405 Adler Point
- 112 Turkey Creek Trail
- 174 Katie Ln
- 469 Lee Williams Rd
- 68 Tyler Ln
- 406 Holly Springs Rd
- 4748 Us Highway 27
- 142 Tyler Ln
- 898 Bowdon Junction Rd
- 676 Hog Liver Rd
- 00 Hog Liver Rd Unit 346
- 0 Hog Liver Rd Unit 148331
- 0 Hog Liver Rd Unit 10630257
- 0 Hog Liver Rd Unit 7671087
- 0 Hog Liver Rd Unit 10614601
- 0 Hog Liver Rd Unit 10630818
- The Thomas 2 Plan at Lambert Overlook
- The Thomas Plan at Lambert Overlook
- The Brook Plan at Lambert Overlook
- 4248 U S 27
- 4248 N Highway 27
- 4226 U S 27
- 4226 N Highway 27
- 4312 U S 27
- 4312 N Highway 27
- 719 Mandeville Ln
- 4328 N Highway 27
- 671 Mandeville Ln
- 4189 U S 27
- 655 Mandeville Ln
- 51 Walnut Hill Rd
- 4189 N Highway 27
- 703 Mandeville Ln
- 65 Walnut Hill Rd
- 711 Mandeville Ln
- 0 Reid Rd Unit 8076481
- 4179 N Highway 27
- 643 Mandeville Ln
- 4292 N Highway 27