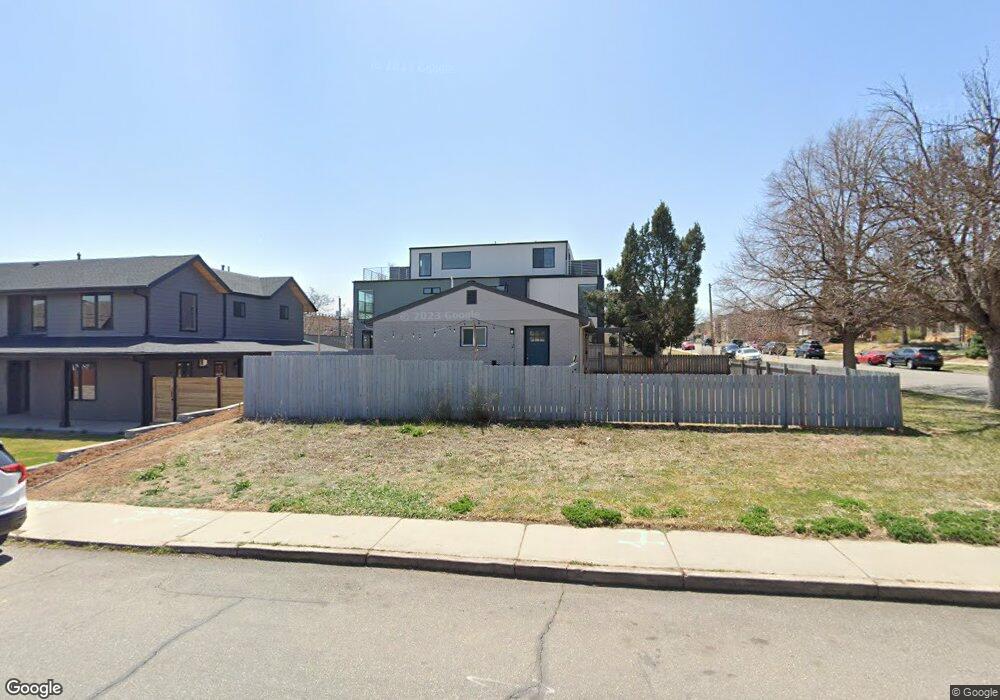
4260 Osage St Denver, CO 80211
Sunnyside NeighborhoodEstimated Value: $608,000 - $752,000
4
Beds
2
Baths
1,714
Sq Ft
$400/Sq Ft
Est. Value
About This Home
This home is located at 4260 Osage St, Denver, CO 80211 and is currently estimated at $684,930, approximately $399 per square foot. 4260 Osage St is a home located in Denver County with nearby schools including Bryant Webster Dual Language School, Denver Montessori Junior/Senior High School, and Skinner Middle School.
Ownership History
Date
Name
Owned For
Owner Type
Purchase Details
Closed on
Aug 25, 2020
Sold by
Gentry Chad
Bought by
Butler Patrick and Butler Patricia
Current Estimated Value
Home Financials for this Owner
Home Financials are based on the most recent Mortgage that was taken out on this home.
Original Mortgage
$361,000
Outstanding Balance
$320,364
Interest Rate
2.9%
Mortgage Type
New Conventional
Estimated Equity
$364,566
Purchase Details
Closed on
Jun 15, 2020
Sold by
4401 Vrain Llc
Bought by
Gentry Chad
Purchase Details
Closed on
Jan 8, 2020
Sold by
Erickson Revocable Trust
Bought by
4401 Vrain Llc
Home Financials for this Owner
Home Financials are based on the most recent Mortgage that was taken out on this home.
Original Mortgage
$448,000
Interest Rate
3.6%
Mortgage Type
Commercial
Purchase Details
Closed on
Jun 5, 2000
Sold by
W John
Bought by
Erickson Revocable Trust
Create a Home Valuation Report for This Property
The Home Valuation Report is an in-depth analysis detailing your home's value as well as a comparison with similar homes in the area
Home Values in the Area
Average Home Value in this Area
Purchase History
| Date | Buyer | Sale Price | Title Company |
|---|---|---|---|
| Butler Patrick | $595,000 | Land Title Guarantee Co | |
| Gentry Chad | $435,000 | Land Title Guarantee Co | |
| 4401 Vrain Llc | $565,000 | Land Title Guarantee Co | |
| Erickson Revocable Trust | -- | -- |
Source: Public Records
Mortgage History
| Date | Status | Borrower | Loan Amount |
|---|---|---|---|
| Open | Butler Patrick | $361,000 | |
| Previous Owner | 4401 Vrain Llc | $448,000 |
Source: Public Records
Tax History Compared to Growth
Tax History
| Year | Tax Paid | Tax Assessment Tax Assessment Total Assessment is a certain percentage of the fair market value that is determined by local assessors to be the total taxable value of land and additions on the property. | Land | Improvement |
|---|---|---|---|---|
| 2024 | $3,680 | $46,460 | $14,900 | $31,560 |
| 2023 | $3,600 | $46,460 | $14,900 | $31,560 |
| 2022 | $2,873 | $36,130 | $16,390 | $19,740 |
| 2021 | $2,873 | $37,170 | $16,860 | $20,310 |
| 2020 | $1,150 | $15,500 | $13,890 | $1,610 |
| 2019 | -- | $32,860 | $32,790 | $70 |
| 2018 | -- | $25,260 | $24,270 | $990 |
| 2017 | -- | $25,260 | $24,270 | $990 |
| 2016 | -- | $21,870 | $17,496 | $4,374 |
| 2015 | -- | $21,870 | $17,496 | $4,374 |
| 2014 | -- | $14,650 | $5,325 | $9,325 |
Source: Public Records
Map
Nearby Homes
- 4252 Osage St
- 4250 Osage St
- 1460 W 43rd Ave
- 4242 Osage St
- 4240 Osage St
- 1475 W 43rd Ave
- 4259 Osage St
- 1455 W 43rd Ave
- 4301 Osage St Unit 2
- 4301 Osage St Unit 8
- 4301 Osage St Unit 6
- 4301 Osage St
- 4303 Navajo St
- 4230 Osage St
- 1515 W 43rd Ave
- 4245 Osage St
- 4251 Navajo St
- 4305 Osage St
- 4247 Navajo St
- 4241 Osage St