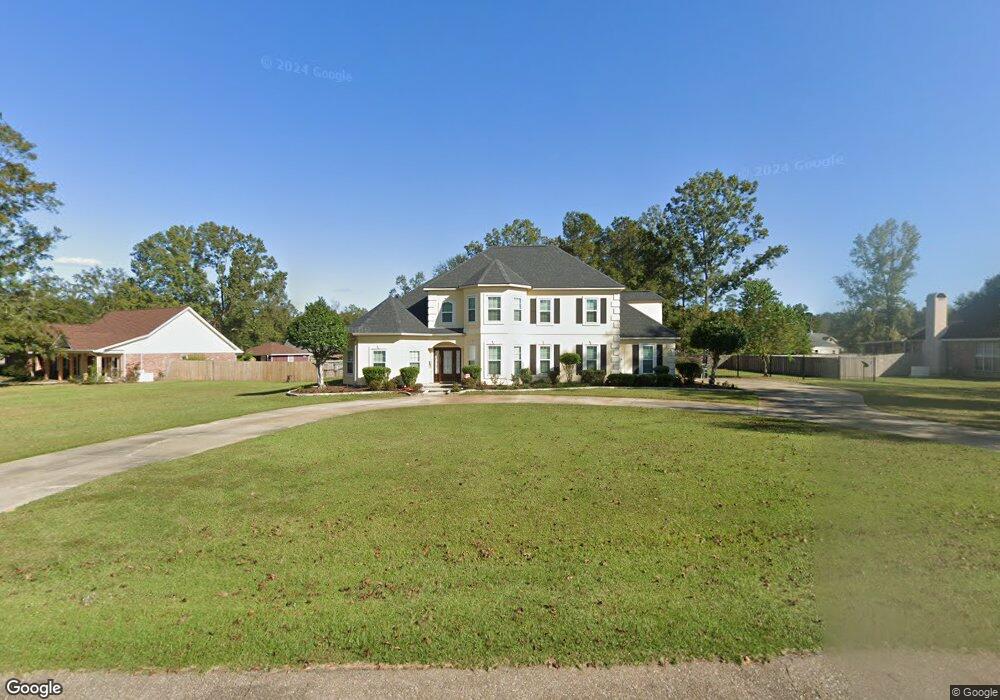
42605 Jefferson Dr Hammond, LA 70403
Estimated Value: $370,000 - $497,000
4
Beds
4
Baths
3,243
Sq Ft
$136/Sq Ft
Est. Value
About This Home
This home is located at 42605 Jefferson Dr, Hammond, LA 70403 and is currently estimated at $440,286, approximately $135 per square foot. 42605 Jefferson Dr is a home located in Tangipahoa Parish with nearby schools including Perrin Early Learning Center, Tucker Memorial Elementary School, and D.C. Reeves Elementary School.
Ownership History
Date
Name
Owned For
Owner Type
Purchase Details
Closed on
Jun 27, 2007
Sold by
First Guaranty Bank
Bought by
Kim Sook Hee and Kim Kyuk
Current Estimated Value
Home Financials for this Owner
Home Financials are based on the most recent Mortgage that was taken out on this home.
Original Mortgage
$238,400
Outstanding Balance
$146,578
Interest Rate
6.19%
Mortgage Type
New Conventional
Estimated Equity
$293,708
Purchase Details
Closed on
May 11, 2007
Sold by
Illes Adrian Andrew and Illes Katherine Sturgill
Bought by
First Guaranity Bank
Home Financials for this Owner
Home Financials are based on the most recent Mortgage that was taken out on this home.
Original Mortgage
$238,400
Outstanding Balance
$146,578
Interest Rate
6.19%
Mortgage Type
New Conventional
Estimated Equity
$293,708
Purchase Details
Closed on
Jun 7, 2006
Sold by
Illes Adrian A
Bought by
Lbi
Create a Home Valuation Report for This Property
The Home Valuation Report is an in-depth analysis detailing your home's value as well as a comparison with similar homes in the area
Home Values in the Area
Average Home Value in this Area
Purchase History
| Date | Buyer | Sale Price | Title Company |
|---|---|---|---|
| Kim Sook Hee | $298,000 | None Available | |
| First Guaranity Bank | $15,137 | None Available | |
| First Guaranty Bank | $15,137 | None Available | |
| Lbi | $2,629 | None Available |
Source: Public Records
Mortgage History
| Date | Status | Borrower | Loan Amount |
|---|---|---|---|
| Open | Kim Sook Hee | $238,400 |
Source: Public Records
Tax History Compared to Growth
Tax History
| Year | Tax Paid | Tax Assessment Tax Assessment Total Assessment is a certain percentage of the fair market value that is determined by local assessors to be the total taxable value of land and additions on the property. | Land | Improvement |
|---|---|---|---|---|
| 2024 | $2,993 | $28,176 | $3,240 | $24,936 |
| 2023 | $3,006 | $27,935 | $3,000 | $24,935 |
| 2022 | $2,964 | $27,935 | $3,000 | $24,935 |
| 2021 | $2,173 | $27,935 | $3,000 | $24,935 |
| 2020 | $2,962 | $27,935 | $3,000 | $24,935 |
| 2019 | $2,983 | $27,935 | $3,000 | $24,935 |
| 2018 | $3,048 | $27,935 | $3,000 | $24,935 |
| 2017 | $2,963 | $27,935 | $3,000 | $24,935 |
| 2016 | $2,991 | $27,935 | $3,000 | $24,935 |
| 2015 | $2,307 | $29,019 | $3,000 | $26,019 |
| 2014 | $2,177 | $29,019 | $3,000 | $26,019 |
Source: Public Records
Map
Nearby Homes
- 13059 Royal Oak Dr
- 13252 General Ott Rd
- 13101 Royal Oak Dr
- 42494 Autumn Dr
- 12503 Morgan Creek Ln
- 12464 Morgan Creek Ln Unit A
- 42251 Jefferson Dr
- 42417 Jasmine Dr
- 43265 Anthon Ln
- 43099 Anthon Ln
- 43058 Happywoods Rd
- 12075 E Adams Rd
- 42640 Happywoods Rd Unit 8
- 12211 Troyville St
- 41357 Countryside Ln
- 43195 Clint Ln
- 42605 Jefferson Dr
- 42605 Jefferson Dr
- 42619 Jefferson Dr
- 42579 Jefferson Dr
- 42606 Jefferson Dr
- 42594 Jefferson Dr
- 42618 Jefferson Dr
- 42511 Jefferson Dr
- 42511 Jefferson Dr
- 42497 Jefferson Dr
- 42481 Jefferson Dr
- 42635 Jefferson Dr
- 42481 Jefferson Dr
- 42635 Jefferson Dr
- 42632 Jefferson Dr
- 42632 Jefferson Dr
- 42632 Jefferson Dr
- 42580 Jefferson Dr
- 42580 Jefferson Dr
- 42566 Jefferson Dr