Estimated Value: $340,000 - $379,006
3
Beds
2
Baths
1,188
Sq Ft
$300/Sq Ft
Est. Value
About This Home
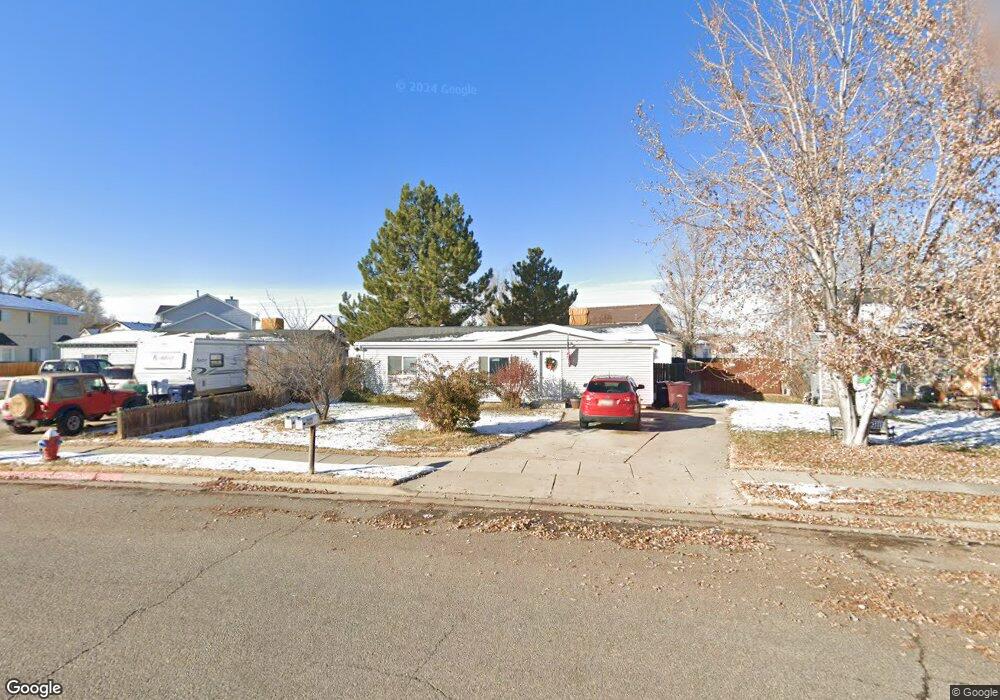
This home is located at 4262 W 5050 S, Roy, UT 84067 and is currently estimated at $356,752, approximately $300 per square foot. 4262 W 5050 S is a home located in Weber County with nearby schools including Country View School, Rocky Mountain Junior High School, and Roy High School.
Ownership History
Date
Name
Owned For
Owner Type
Purchase Details
Closed on
Dec 5, 2024
Sold by
Raincrest Llc
Bought by
Fortunato Callisayam Val
Current Estimated Value
Home Financials for this Owner
Home Financials are based on the most recent Mortgage that was taken out on this home.
Original Mortgage
$325,004
Outstanding Balance
$322,322
Interest Rate
6.54%
Mortgage Type
FHA
Estimated Equity
$34,430
Purchase Details
Closed on
Nov 16, 2017
Sold by
Cragun Les D
Bought by
Raincrest Llc
Purchase Details
Closed on
Sep 8, 2003
Sold by
Federal National Mortgage Association
Bought by
Cragun Les D
Purchase Details
Closed on
Jun 4, 2003
Sold by
Washington Mutual Bank Fa
Bought by
Federal National Mortgage Association
Purchase Details
Closed on
May 23, 2003
Sold by
Royster Jeff A and Royster Julie C
Bought by
Washington Mutual Bank Fa
Create a Home Valuation Report for This Property
The Home Valuation Report is an in-depth analysis detailing your home's value as well as a comparison with similar homes in the area
Home Values in the Area
Average Home Value in this Area
Purchase History
| Date | Buyer | Sale Price | Title Company |
|---|---|---|---|
| Fortunato Callisayam Val | -- | Inwest Title | |
| Raincrest Llc | -- | None Available | |
| Cragun Les D | -- | Us Title | |
| Federal National Mortgage Association | -- | First American Title | |
| Washington Mutual Bank Fa | $90,054 | First Southwestern Title |
Source: Public Records
Mortgage History
| Date | Status | Borrower | Loan Amount |
|---|---|---|---|
| Open | Fortunato Callisayam Val | $325,004 |
Source: Public Records
Tax History Compared to Growth
Tax History
| Year | Tax Paid | Tax Assessment Tax Assessment Total Assessment is a certain percentage of the fair market value that is determined by local assessors to be the total taxable value of land and additions on the property. | Land | Improvement |
|---|---|---|---|---|
| 2025 | $2,269 | $353,443 | $130,241 | $223,202 |
| 2024 | $1,959 | $347,999 | $130,241 | $217,758 |
| 2023 | $1,703 | $303,000 | $122,102 | $180,898 |
| 2022 | $1,975 | $358,000 | $108,169 | $249,831 |
| 2021 | $1,579 | $261,001 | $82,313 | $178,688 |
| 2020 | $1,545 | $233,999 | $82,313 | $151,686 |
| 2019 | $1,434 | $204,999 | $46,848 | $158,151 |
| 2018 | $1,317 | $178,000 | $42,896 | $135,104 |
| 2017 | $1,154 | $147,000 | $42,896 | $104,104 |
| 2016 | $1,174 | $80,638 | $22,658 | $57,980 |
| 2015 | $1,131 | $80,639 | $22,658 | $57,981 |
| 2014 | $1,012 | $71,288 | $19,913 | $51,375 |
Source: Public Records
Map
Nearby Homes