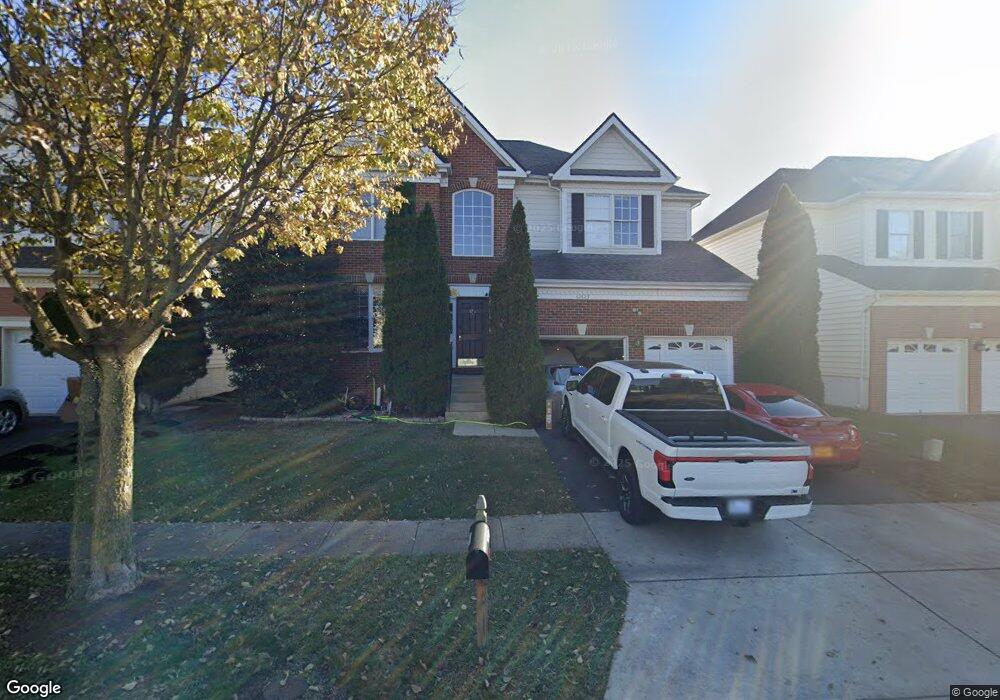
42623 Harris St Chantilly, VA 20152
Estimated Value: $940,112 - $997,000
4
Beds
4
Baths
3,536
Sq Ft
$273/Sq Ft
Est. Value
About This Home
This home is located at 42623 Harris St, Chantilly, VA 20152 and is currently estimated at $964,278, approximately $272 per square foot. 42623 Harris St is a home located in Loudoun County with nearby schools including Hutchison Farm Elementary School, J. Michael Lunsford Middle School, and Freedom High School.
Ownership History
Date
Name
Owned For
Owner Type
Purchase Details
Closed on
Jun 29, 2011
Sold by
Aurora Loan Services Llc
Bought by
Rodriguez Carlos J and Way Karen S
Current Estimated Value
Home Financials for this Owner
Home Financials are based on the most recent Mortgage that was taken out on this home.
Original Mortgage
$448,339
Outstanding Balance
$306,398
Interest Rate
4.37%
Mortgage Type
FHA
Estimated Equity
$657,880
Purchase Details
Closed on
Mar 22, 2011
Sold by
Nectar Projects Inc Tr
Bought by
Aurora Loan Services Llc
Purchase Details
Closed on
Dec 12, 2002
Sold by
South Riding Prtnrs Inc
Bought by
Morris William
Home Financials for this Owner
Home Financials are based on the most recent Mortgage that was taken out on this home.
Original Mortgage
$360,450
Interest Rate
6.17%
Mortgage Type
New Conventional
Create a Home Valuation Report for This Property
The Home Valuation Report is an in-depth analysis detailing your home's value as well as a comparison with similar homes in the area
Home Values in the Area
Average Home Value in this Area
Purchase History
| Date | Buyer | Sale Price | Title Company |
|---|---|---|---|
| Rodriguez Carlos J | $460,000 | -- | |
| Aurora Loan Services Llc | $808,978 | -- | |
| Morris William | $379,442 | -- |
Source: Public Records
Mortgage History
| Date | Status | Borrower | Loan Amount |
|---|---|---|---|
| Open | Rodriguez Carlos J | $448,339 | |
| Previous Owner | Morris William | $360,450 |
Source: Public Records
Tax History
| Year | Tax Paid | Tax Assessment Tax Assessment Total Assessment is a certain percentage of the fair market value that is determined by local assessors to be the total taxable value of land and additions on the property. | Land | Improvement |
|---|---|---|---|---|
| 2025 | $7,731 | $960,430 | $296,400 | $664,030 |
| 2024 | $7,785 | $899,980 | $296,400 | $603,580 |
| 2023 | $7,549 | $862,720 | $311,400 | $551,320 |
| 2022 | $7,027 | $789,530 | $241,400 | $548,130 |
| 2021 | $6,672 | $680,820 | $211,400 | $469,420 |
| 2020 | $6,259 | $604,710 | $196,400 | $408,310 |
| 2019 | $6,236 | $596,780 | $196,400 | $400,380 |
| 2018 | $6,308 | $581,380 | $176,400 | $404,980 |
| 2017 | $6,301 | $560,130 | $176,400 | $383,730 |
| 2016 | $6,379 | $557,100 | $0 | $0 |
| 2015 | $6,166 | $366,850 | $0 | $366,850 |
| 2014 | $6,237 | $363,570 | $0 | $363,570 |
Source: Public Records
Map
Nearby Homes
- 42714 Freedom St
- 42811 Sykes Terrace
- 25488 Crossfield Dr
- 25237 Easterwood Ln
- 42602 Suny Bay Ct
- 25631 Anthem Terrace
- 25382 Whippoorwill Terrace
- 43003 Golf View Dr
- 42634 Offenham Terrace
- 42240 Graves Mountain Terrace
- 42824 Nations St
- 25121 Monteith Terrace
- 0 Braddock Rd Unit VALO2086014
- 25031 Peselby Square
- 42919 Pamplin Terrace
- 42923 Pamplin Terrace
- 43078 Francis Square
- 24991 Rosslare Harbour Terrace
- 24989 Rosslare Harbour Terrace
- 24985 Rosslare Harbour Terrace
- 42627 Harris St
- 42619 Harris St
- 25454 Chambers Dr
- 42631 Harris St
- 25455 Gimbel Dr
- 25458 Chambers Dr
- 42611 Harris St
- 25459 Gimbel Dr
- 42618 Harris St
- 42626 Harris St
- 42630 Harris St
- 42614 Harris St
- 25462 Chambers Dr
- 42634 Harris St
- 25463 Gimbel Dr
- 42643 Harris St
- 42610 Harris St
- 42607 Harris St
- 42638 Harris St
- 25454 Gimbel Dr
Your Personal Tour Guide
Ask me questions while you tour the home.