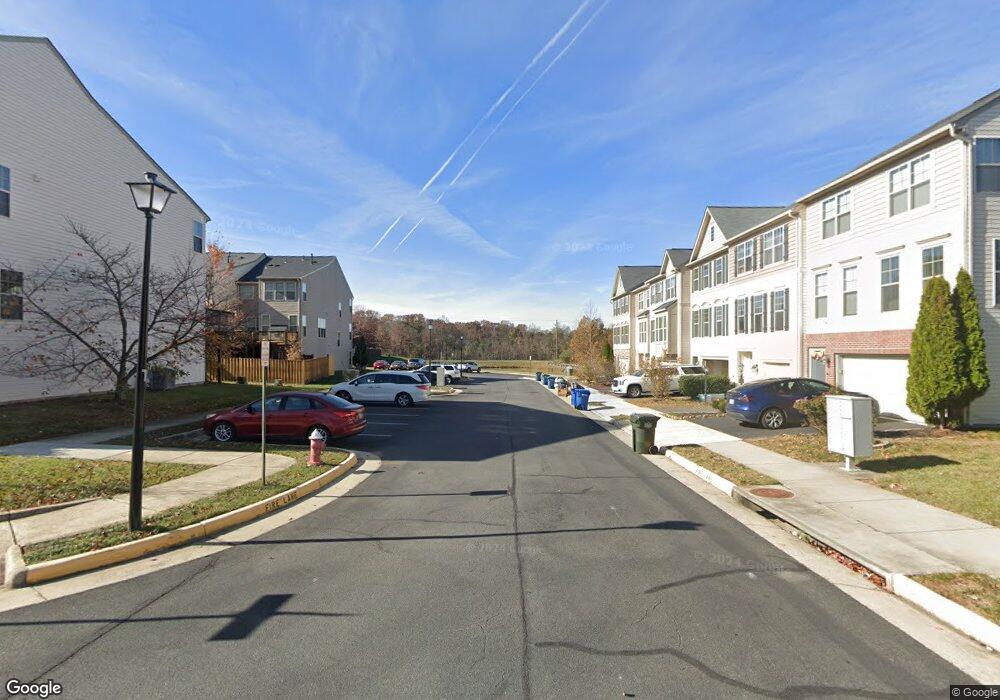
42624 Galbraith Square Ashburn, VA 20146
Estimated Value: $704,000 - $756,000
3
Beds
4
Baths
2,432
Sq Ft
$300/Sq Ft
Est. Value
About This Home
This home is located at 42624 Galbraith Square, Ashburn, VA 20146 and is currently estimated at $729,274, approximately $299 per square foot. 42624 Galbraith Square is a home located in Loudoun County with nearby schools including Waxpool Elementary School, Eagle Ridge Middle School, and Briar Woods High School.
Ownership History
Date
Name
Owned For
Owner Type
Purchase Details
Closed on
Sep 29, 2022
Sold by
Anderson David and Anderson Patrizia
Bought by
Arya Saurabh
Current Estimated Value
Home Financials for this Owner
Home Financials are based on the most recent Mortgage that was taken out on this home.
Original Mortgage
$625,000
Outstanding Balance
$591,454
Interest Rate
4.5%
Mortgage Type
Balloon
Estimated Equity
$137,820
Purchase Details
Closed on
May 31, 2016
Sold by
Noffsinger Guy and Noffsinger Lori A
Bought by
Anderson David and Anderson Patrizia
Home Financials for this Owner
Home Financials are based on the most recent Mortgage that was taken out on this home.
Original Mortgage
$475,180
Interest Rate
3.59%
Mortgage Type
VA
Purchase Details
Closed on
May 30, 2012
Sold by
D R Horton Inc
Bought by
Noffsinger Guy
Home Financials for this Owner
Home Financials are based on the most recent Mortgage that was taken out on this home.
Original Mortgage
$402,870
Interest Rate
3.9%
Mortgage Type
VA
Create a Home Valuation Report for This Property
The Home Valuation Report is an in-depth analysis detailing your home's value as well as a comparison with similar homes in the area
Home Values in the Area
Average Home Value in this Area
Purchase History
| Date | Buyer | Sale Price | Title Company |
|---|---|---|---|
| Arya Saurabh | $595,020 | -- | |
| Anderson David | $460,000 | Hazelwood Title & Escrow Inc | |
| Noffsinger Guy | $390,000 | -- |
Source: Public Records
Mortgage History
| Date | Status | Borrower | Loan Amount |
|---|---|---|---|
| Open | Arya Saurabh | $625,000 | |
| Previous Owner | Anderson David | $475,180 | |
| Previous Owner | Noffsinger Guy | $402,870 |
Source: Public Records
Tax History
| Year | Tax Paid | Tax Assessment Tax Assessment Total Assessment is a certain percentage of the fair market value that is determined by local assessors to be the total taxable value of land and additions on the property. | Land | Improvement |
|---|---|---|---|---|
| 2025 | $5,574 | $692,360 | $243,500 | $448,860 |
| 2024 | $5,713 | $660,430 | $213,500 | $446,930 |
| 2023 | $5,316 | $607,590 | $203,500 | $404,090 |
| 2022 | $5,296 | $595,020 | $183,500 | $411,520 |
| 2021 | $4,944 | $504,470 | $163,500 | $340,970 |
| 2020 | $4,890 | $472,470 | $153,500 | $318,970 |
| 2019 | $4,817 | $460,950 | $153,500 | $307,450 |
| 2018 | $4,772 | $439,860 | $138,500 | $301,360 |
| 2017 | $4,935 | $438,640 | $138,500 | $300,140 |
| 2016 | $4,972 | $434,270 | $0 | $0 |
| 2015 | $5,023 | $304,040 | $0 | $304,040 |
| 2014 | $4,723 | $290,400 | $0 | $290,400 |
Source: Public Records
Map
Nearby Homes
- 22492 Highcroft Terrace
- 22471 Pine Ridge Ct
- 42951 Cloverleaf Ct
- 42629 Black Angus Dr
- 42621 Black Angus Dr
- 42619 Black Angus Dr
- 42617 Black Angus Dr
- 42611 Black Angus Dr
- 22047 Avonworth Square
- 42575 Highgate Terrace
- 42601 Cardinal Trace Terrace
- 22697 Verde Gate Terrace Unit 26D
- 22741 Settlers Trail Terrace
- 42539 Mayflower Terrace Unit 301
- 22407 Dolomite Hills Dr
- 22555 Blue Elder Terrace
- 22773 Highcrest Cir
- 43024 La Riva Dr
- 21824 Wingfoot Ct
- 43157 Clarendon Square
- 42620 Galbraith Square
- 42618 Galbraith Square
- 42616 Galbraith Square
- 42614 Galbraith Square
- 42624 Galbraith Square
- 42610 Galbraith Square
- 22167 Breitling Terrace
- 42626 Galbraith Square
- 42628 Galbraith Square
- 22169 Breitling Terrace
- 42601 Galbraith Square
- 42630 Galbraith Square
- 22171 Breitling Terrace
- 42632 Galbraith Square
- 42599 Galbraith Square
- 42597 Galbraith Square
- 22166 Breitling Terrace
- 22173 Breitling Terrace
- 22175 Breitling Terrace
- 22168 Breitling Terrace
Your Personal Tour Guide
Ask me questions while you tour the home.