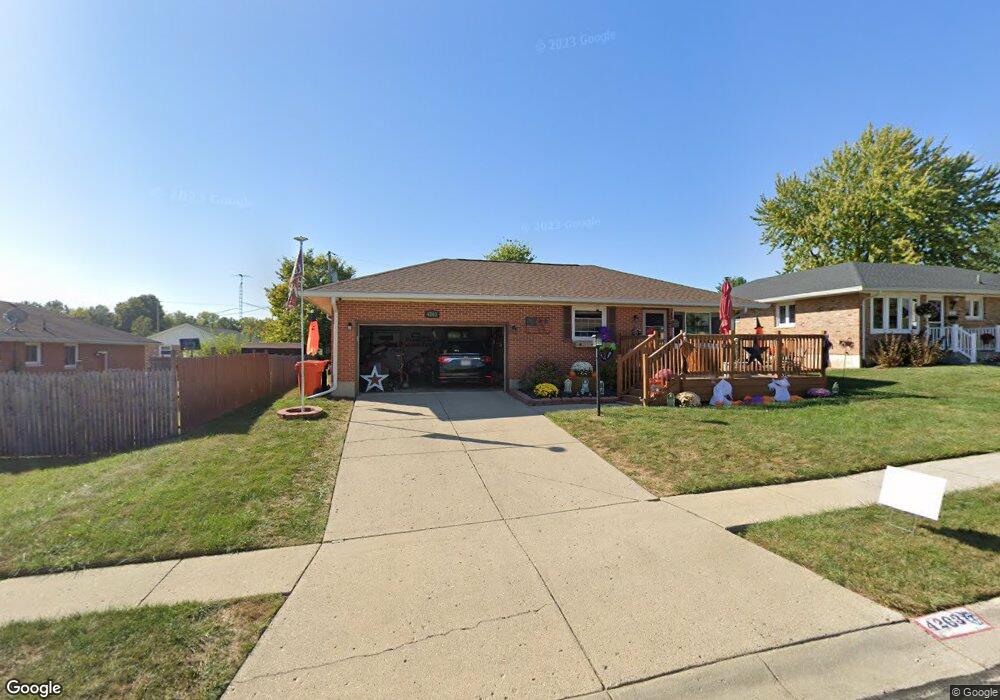
4263 Tritle Trail Springfield, OH 45503
Estimated Value: $187,952 - $223,000
3
Beds
1
Bath
1,075
Sq Ft
$192/Sq Ft
Est. Value
About This Home
This home is located at 4263 Tritle Trail, Springfield, OH 45503 and is currently estimated at $206,488, approximately $192 per square foot. 4263 Tritle Trail is a home located in Clark County with nearby schools including Rolling Hills Elementary School, Northridge Elementary School, and Northridge Middle School.
Ownership History
Date
Name
Owned For
Owner Type
Purchase Details
Closed on
Jan 23, 2015
Sold by
U S Bank Trust Na
Bought by
Wirick Blake and Silvers Allison
Current Estimated Value
Home Financials for this Owner
Home Financials are based on the most recent Mortgage that was taken out on this home.
Original Mortgage
$88,775
Outstanding Balance
$67,390
Interest Rate
3.6%
Mortgage Type
New Conventional
Estimated Equity
$139,098
Purchase Details
Closed on
Jun 11, 2014
Sold by
Potter Brett
Bought by
U S Bank N A
Purchase Details
Closed on
Oct 2, 2007
Sold by
Horn Mary Ann
Bought by
Potter Brett M and Winget Jennifer L
Home Financials for this Owner
Home Financials are based on the most recent Mortgage that was taken out on this home.
Original Mortgage
$120,607
Interest Rate
6.55%
Mortgage Type
FHA
Purchase Details
Closed on
Oct 16, 1991
Sold by
Strange Walter A and Caroline V
Bought by
Horn Mary Ann
Purchase Details
Closed on
Aug 25, 1986
Create a Home Valuation Report for This Property
The Home Valuation Report is an in-depth analysis detailing your home's value as well as a comparison with similar homes in the area
Home Values in the Area
Average Home Value in this Area
Purchase History
| Date | Buyer | Sale Price | Title Company |
|---|---|---|---|
| Wirick Blake | $87,000 | Prism Title & Closing Svcs L | |
| U S Bank N A | $80,000 | Attorney | |
| Potter Brett M | $122,500 | Partners Land Title Agency | |
| Horn Mary Ann | $65,900 | -- | |
| -- | $52,200 | -- |
Source: Public Records
Mortgage History
| Date | Status | Borrower | Loan Amount |
|---|---|---|---|
| Open | Wirick Blake | $88,775 | |
| Previous Owner | Potter Brett M | $120,607 |
Source: Public Records
Tax History Compared to Growth
Tax History
| Year | Tax Paid | Tax Assessment Tax Assessment Total Assessment is a certain percentage of the fair market value that is determined by local assessors to be the total taxable value of land and additions on the property. | Land | Improvement |
|---|---|---|---|---|
| 2024 | $1,854 | $43,850 | $9,720 | $34,130 |
| 2023 | $1,854 | $43,850 | $9,720 | $34,130 |
| 2022 | $1,847 | $43,850 | $9,720 | $34,130 |
| 2021 | $1,847 | $36,850 | $7,200 | $29,650 |
| 2020 | $1,849 | $36,850 | $7,200 | $29,650 |
| 2019 | $1,884 | $36,850 | $7,200 | $29,650 |
| 2018 | $1,878 | $35,210 | $9,170 | $26,040 |
| 2017 | $1,610 | $31,777 | $9,174 | $22,603 |
| 2016 | $1,599 | $31,777 | $9,174 | $22,603 |
| 2015 | $1,505 | $31,423 | $8,820 | $22,603 |
| 2014 | $1,464 | $31,423 | $8,820 | $22,603 |
| 2013 | $1,430 | $31,423 | $8,820 | $22,603 |
Source: Public Records
Map
Nearby Homes
- 4109 Derr Rd
- 1139 Greenoak Ct
- 970 Forest Edge Ave
- 1461 Student Ave
- 916 Sawmill Ct
- 4622 W Ridgewood Rd
- 880 Brendle Trace Unit 28
- 4514 Dowden St
- 794 Donnelly Ave
- 4712 Cullen Ave
- 1162 Kingsgate Rd
- 4446 Ridgewood Rd E Unit 3
- 4438 Tacoma St
- 4050 Tacoma St
- 1640 Montego Dr
- 593 Hiser Ave
- 4512 Ridgewood Rd E
- 4249 Reno Rd
- 4275 Tritle Trail
- 1078 Montego Dr
- 4260 Prince Cir
- 4287 Tritle Trail
- 4278 Prince Cir
- 1060 Montego Dr
- 4256 Tritle Trail
- 4290 Prince Cir
- 4342 Tudor Cir
- 4268 Tritle Trail
- 4303 Tritle Trail
- 4284 Tritle Trail
- 4241 Tritle Trail
- 4310 Prince Cir
- 1065 Montego Dr
- 1122 Montego Dr
- 4311 Tritle Trail
- 4304 Tritle Trail
- 1053 Montego Dr
- 4242 Tritle Trail