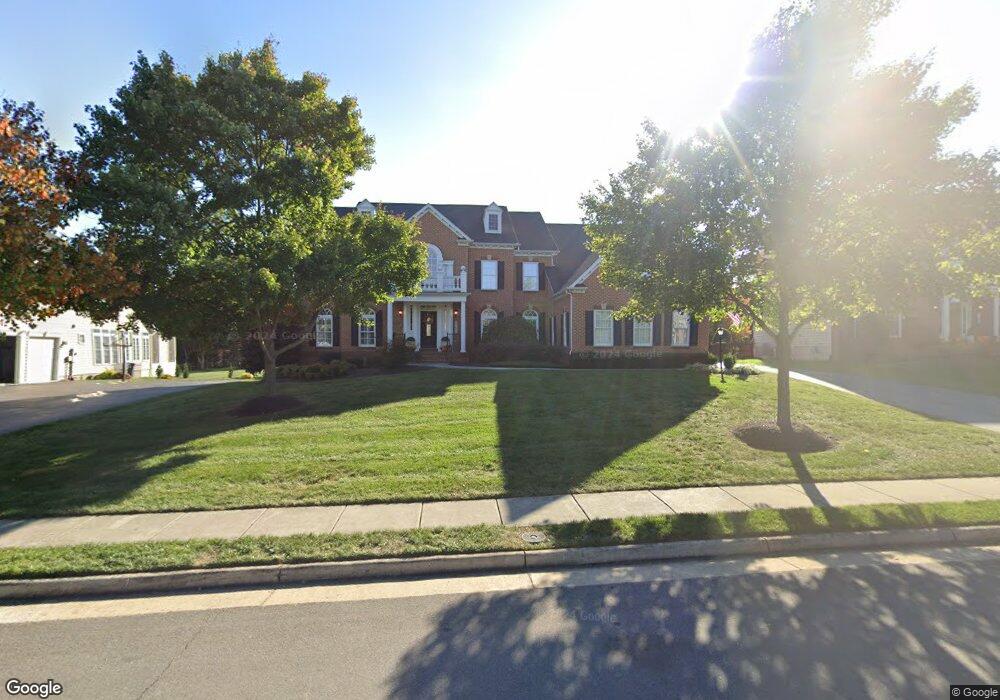
42645 Bradfords Telegraph Ct Chantilly, VA 20152
Estimated Value: $1,373,000 - $1,648,000
5
Beds
6
Baths
7,272
Sq Ft
$208/Sq Ft
Est. Value
About This Home
This home is located at 42645 Bradfords Telegraph Ct, Chantilly, VA 20152 and is currently estimated at $1,515,058, approximately $208 per square foot. 42645 Bradfords Telegraph Ct is a home located in Loudoun County with nearby schools including Hutchison Farm Elementary School, J. Michael Lunsford Middle School, and Freedom High School.
Ownership History
Date
Name
Owned For
Owner Type
Purchase Details
Closed on
Apr 29, 2021
Sold by
Hurst James M and Hurst Barbara G
Bought by
Kilgariff John J and Oliver-Kilgariff Traci R
Current Estimated Value
Home Financials for this Owner
Home Financials are based on the most recent Mortgage that was taken out on this home.
Original Mortgage
$999,804
Outstanding Balance
$904,655
Interest Rate
3%
Mortgage Type
VA
Estimated Equity
$610,403
Purchase Details
Closed on
Oct 25, 2019
Sold by
Hurst James M and Hurst Barbara G
Bought by
Hurst James M and Hurst Barbara Fay
Purchase Details
Closed on
Dec 14, 2006
Sold by
Nvr Inc
Bought by
Hurst James M
Home Financials for this Owner
Home Financials are based on the most recent Mortgage that was taken out on this home.
Original Mortgage
$891,800
Interest Rate
6.31%
Mortgage Type
New Conventional
Create a Home Valuation Report for This Property
The Home Valuation Report is an in-depth analysis detailing your home's value as well as a comparison with similar homes in the area
Home Values in the Area
Average Home Value in this Area
Purchase History
| Date | Buyer | Sale Price | Title Company |
|---|---|---|---|
| Kilgariff John J | $1,150,000 | Ekko Title | |
| Hurst James M | -- | None Available | |
| Hurst James M | $1,114,764 | -- |
Source: Public Records
Mortgage History
| Date | Status | Borrower | Loan Amount |
|---|---|---|---|
| Open | Kilgariff John J | $999,804 | |
| Previous Owner | Hurst James M | $891,800 |
Source: Public Records
Tax History Compared to Growth
Tax History
| Year | Tax Paid | Tax Assessment Tax Assessment Total Assessment is a certain percentage of the fair market value that is determined by local assessors to be the total taxable value of land and additions on the property. | Land | Improvement |
|---|---|---|---|---|
| 2025 | $12,979 | $1,612,330 | $399,700 | $1,212,630 |
| 2024 | $13,221 | $1,528,470 | $399,700 | $1,128,770 |
| 2023 | $11,884 | $1,358,140 | $399,700 | $958,440 |
| 2022 | $10,970 | $1,232,560 | $279,700 | $952,860 |
| 2021 | $9,742 | $994,100 | $249,700 | $744,400 |
| 2020 | $9,577 | $925,270 | $229,700 | $695,570 |
| 2019 | $9,512 | $910,220 | $229,700 | $680,520 |
| 2018 | $9,865 | $909,180 | $209,500 | $699,680 |
| 2017 | $9,702 | $862,380 | $209,500 | $652,880 |
| 2016 | $9,958 | $869,720 | $0 | $0 |
| 2015 | $10,188 | $688,150 | $0 | $688,150 |
| 2014 | $9,258 | $592,050 | $0 | $592,050 |
Source: Public Records
Map
Nearby Homes
- 0 Braddock Rd Unit VALO2086014
- 42783 Shaler St
- 42835 Shaler St
- 42783 Freedom St
- 42721 Center St
- 25857 Kirkwood Square
- 42768 Kearney Terrace
- 42790 Sykes Terrace
- 25817 Mews Terrace
- 25670 S Village Dr
- 25449 Brickell Dr
- 42276 Magistrate Ct
- 25298 Shipley Terrace
- 25710 S Village Dr
- 42893 Golf View Dr
- 25541 Gwynneth Square
- 43005 Beachall St
- 25472 Hartland Orchard Terrace
- 25944 Donovan Dr
- 25434 Nichols Orchard Terrace
- 42641 Bradfords Telegraph Ct
- 42649 Bradfords Telegraph Ct
- 42637 Bradfords Telegraph Ct
- 42653 Bradfords Telegraph Ct
- 42618 Suny Bay Ct
- 42622 Suny Bay Ct
- 42644 Bradfords Telegraph Ct
- 42614 Suny Bay Ct
- 42648 Bradfords Telegraph Ct
- 42657 Bradfords Telegraph Ct
- 25690 Donerails Chase Dr
- 42610 Suny Bay Ct
- 42656 Bradfords Telegraph Ct
- 42632 Bradfords Telegraph Ct
- 42602 Suny Bay Ct
- 42661 Bradfords Telegraph Ct
- 42627 Suny Bay Ct
- 42660 Bradfords Telegraph Ct
- 42598 Suny Bay Ct
- 42619 Suny Bay Ct