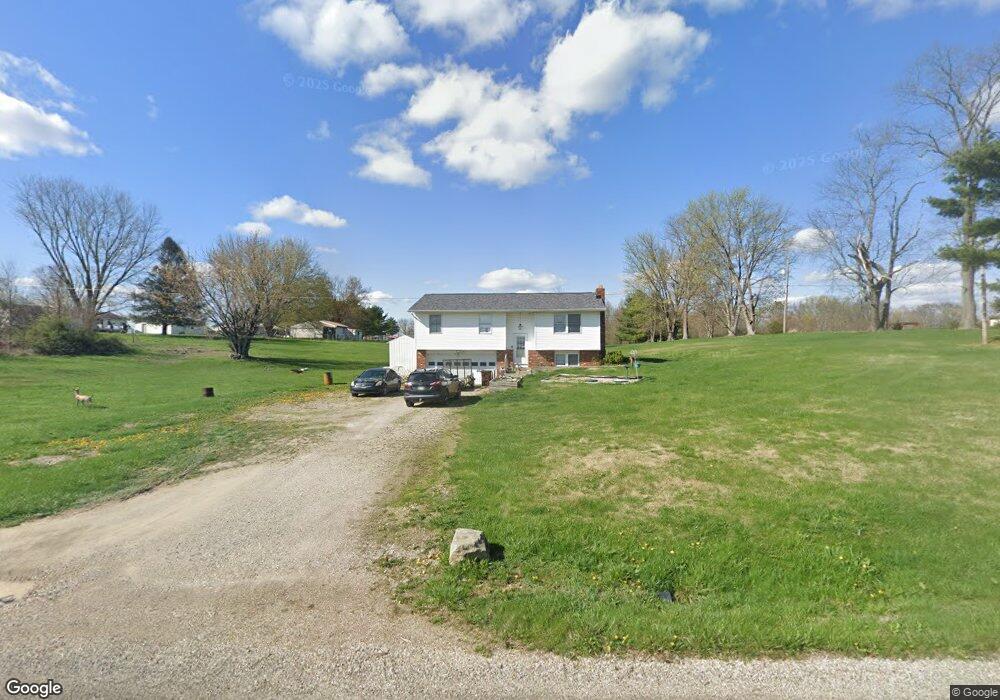
4265 Tucker Rd Zanesville, OH 43701
Estimated Value: $262,000 - $325,000
3
Beds
2
Baths
1,434
Sq Ft
$200/Sq Ft
Est. Value
About This Home
This home is located at 4265 Tucker Rd, Zanesville, OH 43701 and is currently estimated at $286,288, approximately $199 per square foot. 4265 Tucker Rd is a home located in Muskingum County with nearby schools including Tri-Valley High School.
Ownership History
Date
Name
Owned For
Owner Type
Purchase Details
Closed on
Nov 6, 2008
Sold by
Mozena Marshall and Mozena Jessica
Bought by
Mozena Bernice C
Current Estimated Value
Purchase Details
Closed on
Feb 21, 2008
Sold by
Hud
Bought by
Mozena Marshall
Purchase Details
Closed on
Jul 27, 2007
Sold by
Dicks Cory L
Bought by
Hud
Purchase Details
Closed on
May 30, 2003
Sold by
Krischak James R and Krischak Trudy G
Bought by
Dicks Cory L and Dicks Leslie
Home Financials for this Owner
Home Financials are based on the most recent Mortgage that was taken out on this home.
Original Mortgage
$99,711
Interest Rate
5.88%
Mortgage Type
FHA
Purchase Details
Closed on
Jan 28, 2003
Sold by
Jordan Rose E
Bought by
Krischak James R and Krischak Trudy G
Home Financials for this Owner
Home Financials are based on the most recent Mortgage that was taken out on this home.
Original Mortgage
$71,195
Interest Rate
6.13%
Mortgage Type
New Conventional
Create a Home Valuation Report for This Property
The Home Valuation Report is an in-depth analysis detailing your home's value as well as a comparison with similar homes in the area
Home Values in the Area
Average Home Value in this Area
Purchase History
| Date | Buyer | Sale Price | Title Company |
|---|---|---|---|
| Mozena Bernice C | -- | Attorney | |
| Mozena Marshall | $58,000 | None Available | |
| Hud | $70,000 | None Available | |
| Dicks Cory L | $100,500 | -- | |
| Krischak James R | $71,100 | -- |
Source: Public Records
Mortgage History
| Date | Status | Borrower | Loan Amount |
|---|---|---|---|
| Previous Owner | Dicks Cory L | $99,711 | |
| Previous Owner | Krischak James R | $71,195 |
Source: Public Records
Tax History Compared to Growth
Tax History
| Year | Tax Paid | Tax Assessment Tax Assessment Total Assessment is a certain percentage of the fair market value that is determined by local assessors to be the total taxable value of land and additions on the property. | Land | Improvement |
|---|---|---|---|---|
| 2024 | $1,620 | $50,015 | $9,240 | $40,775 |
| 2023 | $1,062 | $31,185 | $5,810 | $25,375 |
| 2022 | $1,034 | $31,185 | $5,810 | $25,375 |
| 2021 | $1,018 | $31,185 | $5,810 | $25,375 |
| 2020 | $936 | $28,385 | $5,285 | $23,100 |
| 2019 | $905 | $28,175 | $5,285 | $22,890 |
| 2018 | $908 | $28,175 | $5,285 | $22,890 |
| 2017 | $881 | $26,005 | $5,285 | $20,720 |
| 2016 | $926 | $25,420 | $5,290 | $20,130 |
| 2015 | $897 | $25,420 | $5,290 | $20,130 |
| 2013 | $1,014 | $25,420 | $5,290 | $20,130 |
Source: Public Records
Map
Nearby Homes
- 0 Sonora Rd Unit 225018643
- 0 Sonora Rd Unit 5125925
- 1605 Gilbert Rd
- 7855 East St
- 5470 N River Rd E
- 5470 N River Rd
- 1305 Bald Hill Rd
- 2835 Adamsville Rd
- 1605 Jackson Rd
- 310 Trappers Hollow Rd
- 130 Airport Rd
- 4460 East Pike
- 6600 Bridgeville Dr
- 360 Walters Way
- 365 Walters Way
- 7115 East Pike
- 400 Spring Valley Dr
- 0 Bateman Rd
- 6265 Canterbury Way Unit LOT 30
- 3025 Virginia Ave
- 4285 Tucker Rd
- 5640 Adamsville Rd
- 4325 Tucker Rd
- 5650 Adamsville Rd
- 5575 Adamsville Rd
- 5645 Adamsville Rd
- 5565 Adamsville Rd
- 4355 Tucker Rd
- 5660 Adamsville Rd
- 5690 Adamsville Rd
- 4375 Tucker Rd
- 5720 Adamsville Rd
- 5465 Adamsville Rd
- 4125 E Greenwood Rd
- 5740 Adamsville Rd
- 5780 Adamsville Rd
- 5830 Adamsville Rd
- 4485 Tucker Rd
- 5270 Adamsville Rd
- 5870 Adamsville Rd