Estimated Value: $384,000 - $413,000
3
Beds
1
Bath
1,409
Sq Ft
$286/Sq Ft
Est. Value
About This Home
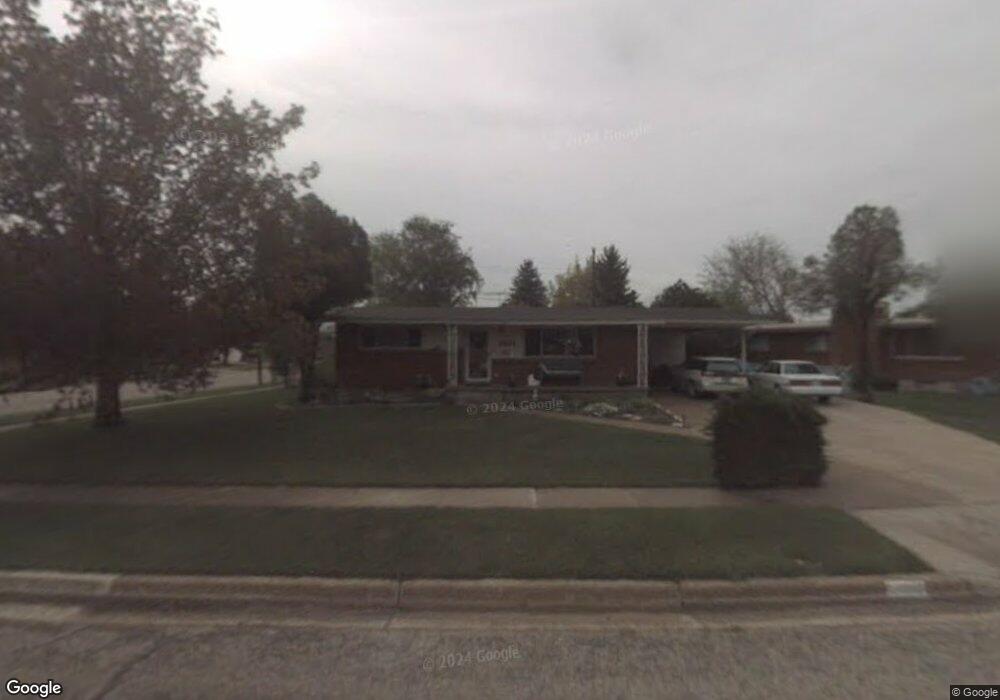
This home is located at 4266 S 2325 W, Roy, UT 84067 and is currently estimated at $402,521, approximately $285 per square foot. 4266 S 2325 W is a home located in Weber County with nearby schools including North Park School, Sand Ridge Junior High School, and Roy High School.
Ownership History
Date
Name
Owned For
Owner Type
Purchase Details
Closed on
Sep 30, 2021
Sold by
Morrise Mark J and Morrise Morrisejesard
Bought by
Morrise Michael Scott and Morrise Glenda
Current Estimated Value
Home Financials for this Owner
Home Financials are based on the most recent Mortgage that was taken out on this home.
Original Mortgage
$243,360
Interest Rate
2.8%
Mortgage Type
VA
Purchase Details
Closed on
Aug 9, 1996
Sold by
Morrise Jesard and Morrise Martha P
Bought by
Morrise Jesard and Morrise Martha P
Create a Home Valuation Report for This Property
The Home Valuation Report is an in-depth analysis detailing your home's value as well as a comparison with similar homes in the area
Home Values in the Area
Average Home Value in this Area
Purchase History
| Date | Buyer | Sale Price | Title Company |
|---|---|---|---|
| Morrise Michael Scott | -- | Benchmark Title Ins Agcy | |
| Morrise Jesard | -- | -- |
Source: Public Records
Mortgage History
| Date | Status | Borrower | Loan Amount |
|---|---|---|---|
| Closed | Morrise Michael Scott | $243,360 |
Source: Public Records
Tax History Compared to Growth
Tax History
| Year | Tax Paid | Tax Assessment Tax Assessment Total Assessment is a certain percentage of the fair market value that is determined by local assessors to be the total taxable value of land and additions on the property. | Land | Improvement |
|---|---|---|---|---|
| 2025 | $2,601 | $412,021 | $123,559 | $288,462 |
| 2024 | $2,538 | $222,749 | $67,965 | $154,784 |
| 2023 | $2,453 | $215,600 | $62,578 | $153,022 |
| 2022 | $2,451 | $221,650 | $54,616 | $167,034 |
| 2021 | $2,028 | $301,000 | $69,380 | $231,620 |
| 2020 | $1,868 | $254,000 | $69,380 | $184,620 |
| 2019 | $1,750 | $223,000 | $40,048 | $182,952 |
| 2018 | $1,633 | $195,000 | $37,028 | $157,972 |
| 2017 | $1,596 | $179,000 | $37,028 | $141,972 |
| 2016 | $1,435 | $85,616 | $17,771 | $67,845 |
| 2015 | $1,257 | $75,814 | $17,771 | $58,043 |
| 2014 | $1,267 | $75,814 | $17,771 | $58,043 |
Source: Public Records
Map
Nearby Homes