Estimated Value: $442,465 - $452,000
3
Beds
1
Bath
2,128
Sq Ft
$211/Sq Ft
Est. Value
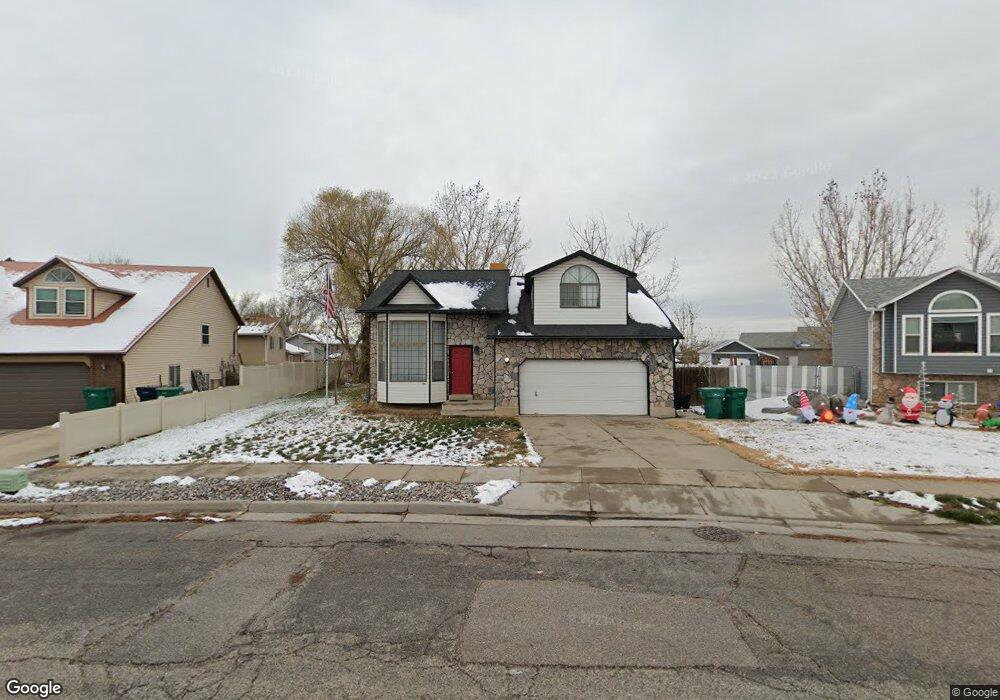
About This Home
This home is located at 4267 S 2975 W, Roy, UT 84067 and is currently estimated at $448,366, approximately $210 per square foot. 4267 S 2975 W is a home located in Weber County with nearby schools including Valley View School, Sand Ridge Junior High School, and Roy High School.
Ownership History
Date
Name
Owned For
Owner Type
Purchase Details
Closed on
Nov 15, 2018
Sold by
Nygard Karl
Bought by
Trussell Donald Lee
Current Estimated Value
Home Financials for this Owner
Home Financials are based on the most recent Mortgage that was taken out on this home.
Original Mortgage
$232,655
Outstanding Balance
$204,573
Interest Rate
4.8%
Mortgage Type
New Conventional
Estimated Equity
$243,793
Purchase Details
Closed on
Apr 6, 2018
Sold by
Humphreys Terry R
Bought by
Nygard Karl
Purchase Details
Closed on
Aug 25, 2017
Sold by
Humphreys Terry R
Bought by
Humphreys Terry R
Home Financials for this Owner
Home Financials are based on the most recent Mortgage that was taken out on this home.
Original Mortgage
$175,569
Interest Rate
3.96%
Mortgage Type
FHA
Create a Home Valuation Report for This Property
The Home Valuation Report is an in-depth analysis detailing your home's value as well as a comparison with similar homes in the area
Home Values in the Area
Average Home Value in this Area
Purchase History
| Date | Buyer | Sale Price | Title Company |
|---|---|---|---|
| Trussell Donald Lee | -- | Mountain America Title | |
| Nygard Karl | -- | Title Guarantee | |
| Humphreys Terry R | -- | None Available |
Source: Public Records
Mortgage History
| Date | Status | Borrower | Loan Amount |
|---|---|---|---|
| Open | Trussell Donald Lee | $232,655 | |
| Previous Owner | Humphreys Terry R | $175,569 |
Source: Public Records
Tax History Compared to Growth
Tax History
| Year | Tax Paid | Tax Assessment Tax Assessment Total Assessment is a certain percentage of the fair market value that is determined by local assessors to be the total taxable value of land and additions on the property. | Land | Improvement |
|---|---|---|---|---|
| 2025 | $2,639 | $418,738 | $141,934 | $276,804 |
| 2024 | $2,578 | $226,599 | $78,070 | $148,529 |
| 2023 | $2,571 | $227,150 | $73,037 | $154,113 |
| 2022 | $2,545 | $231,000 | $62,153 | $168,847 |
| 2021 | $2,083 | $310,000 | $78,037 | $231,963 |
| 2020 | $1,987 | $272,000 | $78,037 | $193,963 |
| 2019 | $1,834 | $235,000 | $52,425 | $182,575 |
| 2018 | $1,736 | $209,000 | $47,429 | $161,571 |
| 2017 | $1,612 | $181,000 | $45,479 | $135,521 |
| 2016 | $1,592 | $96,416 | $22,614 | $73,802 |
| 2015 | $1,420 | $87,347 | $22,614 | $64,733 |
| 2014 | $1,398 | $84,984 | $22,614 | $62,370 |
Source: Public Records
Map
Nearby Homes
- 3084 W 4375 S
- 2835 W 4200 S
- 2816 W 4400 S
- 2802 W 4375 S
- 2777 W 4175 S Unit 229
- 2778 W 4175 S Unit 235
- 4440 Stone Creek Rd Unit 2E
- 2917 W 3970 S Unit 53
- 4317 S 3350 W
- 3891 S 2940 W
- 4635 S 2950 W
- 3229 W 3855 S
- 3866 S 2970 W
- 3114 S 3175 W Unit 21
- 3117 S 3175 W Unit 12
- 3111 S 3175 W Unit 11
- 4510 Stone Creek Rd Unit F
- 3835 S 3250 W
- 3829 S 3250 W
- 4491 Haven Creek Rd Unit A