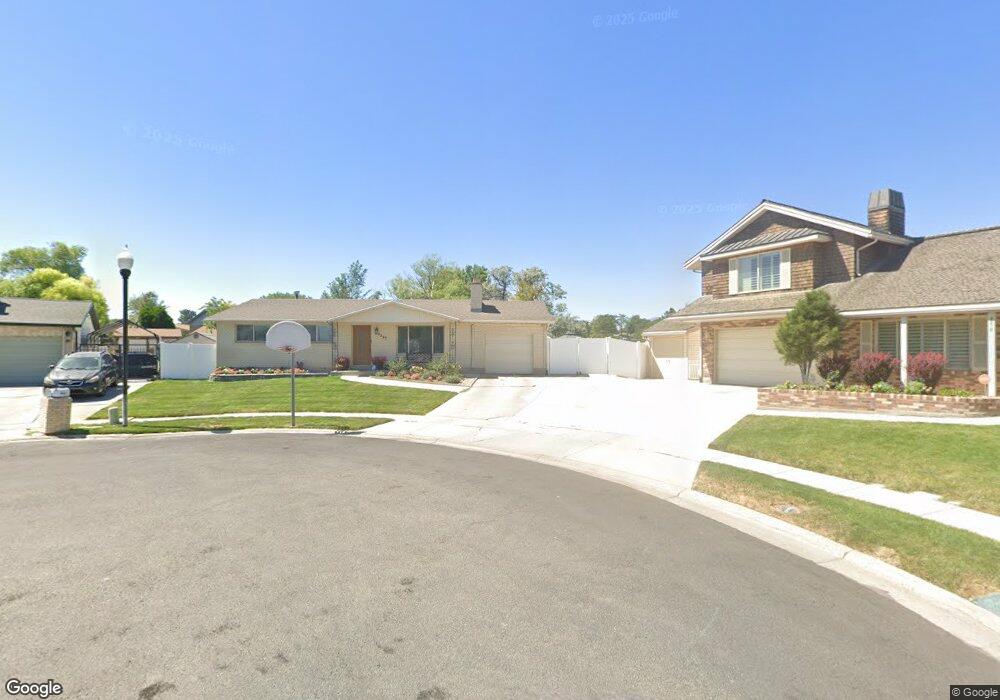
4267 Sherm Cir Salt Lake City, UT 84120
Granger NeighborhoodEstimated Value: $474,000 - $487,000
4
Beds
2
Baths
1,197
Sq Ft
$402/Sq Ft
Est. Value
About This Home
This home is located at 4267 Sherm Cir, Salt Lake City, UT 84120 and is currently estimated at $481,462, approximately $402 per square foot. 4267 Sherm Cir is a home located in Salt Lake County with nearby schools including Philo T Farnsworth Elementary School, Valley Junior High School, and Granger High School.
Ownership History
Date
Name
Owned For
Owner Type
Purchase Details
Closed on
Jan 25, 2021
Sold by
Midence Jorge Armando and Midence Keli
Bought by
Midence Keli Marie and Midence Jorge Armando
Current Estimated Value
Home Financials for this Owner
Home Financials are based on the most recent Mortgage that was taken out on this home.
Original Mortgage
$250,000
Outstanding Balance
$204,032
Interest Rate
2.71%
Mortgage Type
New Conventional
Estimated Equity
$277,430
Purchase Details
Closed on
Jan 19, 2021
Sold by
Midence Jorge Armando and Midence Keli
Bought by
Midence Keli Marie and Midence Jorge Armando
Home Financials for this Owner
Home Financials are based on the most recent Mortgage that was taken out on this home.
Original Mortgage
$250,000
Outstanding Balance
$204,032
Interest Rate
2.71%
Mortgage Type
New Conventional
Estimated Equity
$277,430
Purchase Details
Closed on
Jan 8, 2018
Sold by
Midence Jorge Armando and Midence Keli M
Bought by
Midance Jorge Armando and Midance Keli
Home Financials for this Owner
Home Financials are based on the most recent Mortgage that was taken out on this home.
Original Mortgage
$184,000
Interest Rate
3.9%
Mortgage Type
New Conventional
Purchase Details
Closed on
Jan 29, 2007
Sold by
Midence Jorge Armando and Midence Keli
Bought by
Midence Jorge Armando and Midence Keli M
Home Financials for this Owner
Home Financials are based on the most recent Mortgage that was taken out on this home.
Original Mortgage
$160,000
Interest Rate
6.11%
Mortgage Type
Stand Alone Refi Refinance Of Original Loan
Purchase Details
Closed on
Dec 22, 2004
Sold by
Swenson Kevin W and Swenson Eve S
Bought by
Midence Jorge Armando and Midence Keli
Home Financials for this Owner
Home Financials are based on the most recent Mortgage that was taken out on this home.
Original Mortgage
$122,000
Interest Rate
6.57%
Mortgage Type
Purchase Money Mortgage
Purchase Details
Closed on
Oct 28, 2002
Sold by
Swenson Kevin W and Swenson Eve S
Bought by
Swenson Kevin W and Swenson Eve S
Home Financials for this Owner
Home Financials are based on the most recent Mortgage that was taken out on this home.
Original Mortgage
$106,500
Interest Rate
5.39%
Mortgage Type
Purchase Money Mortgage
Create a Home Valuation Report for This Property
The Home Valuation Report is an in-depth analysis detailing your home's value as well as a comparison with similar homes in the area
Home Values in the Area
Average Home Value in this Area
Purchase History
| Date | Buyer | Sale Price | Title Company |
|---|---|---|---|
| Midence Keli Marie | -- | Meridian Title | |
| Midence Keli Marie | -- | Meridian Title | |
| Midance Jorge Armando | -- | Meridian Title | |
| Midence Jorge Armando | -- | Executive Title Ins Agency | |
| Midence Jorge Armando | -- | Canyon View Title Ins Agency | |
| Swenson Kevin W | -- | First American Title |
Source: Public Records
Mortgage History
| Date | Status | Borrower | Loan Amount |
|---|---|---|---|
| Open | Midence Keli Marie | $250,000 | |
| Closed | Midence Keli Marie | $250,000 | |
| Previous Owner | Midance Jorge Armando | $184,000 | |
| Previous Owner | Midence Jorge Armando | $160,000 | |
| Previous Owner | Midence Jorge Armando | $122,000 | |
| Previous Owner | Swenson Kevin W | $106,500 | |
| Closed | Midence Jorge Armando | $30,500 |
Source: Public Records
Tax History Compared to Growth
Tax History
| Year | Tax Paid | Tax Assessment Tax Assessment Total Assessment is a certain percentage of the fair market value that is determined by local assessors to be the total taxable value of land and additions on the property. | Land | Improvement |
|---|---|---|---|---|
| 2025 | $2,952 | $451,000 | $103,900 | $347,100 |
| 2024 | $2,952 | $452,300 | $103,300 | $349,000 |
| 2023 | $2,952 | $402,600 | $99,300 | $303,300 |
| 2022 | $2,529 | $371,900 | $97,400 | $274,500 |
| 2021 | $2,249 | $297,300 | $74,900 | $222,400 |
| 2020 | $2,082 | $259,700 | $74,900 | $184,800 |
| 2019 | $2,103 | $253,100 | $70,600 | $182,500 |
| 2018 | $0 | $231,200 | $70,600 | $160,600 |
| 2017 | $1,803 | $212,700 | $70,600 | $142,100 |
| 2016 | $1,699 | $200,800 | $70,600 | $130,200 |
| 2015 | $1,618 | $182,000 | $87,300 | $94,700 |
| 2014 | $1,550 | $170,800 | $82,800 | $88,000 |
Source: Public Records
Map
Nearby Homes