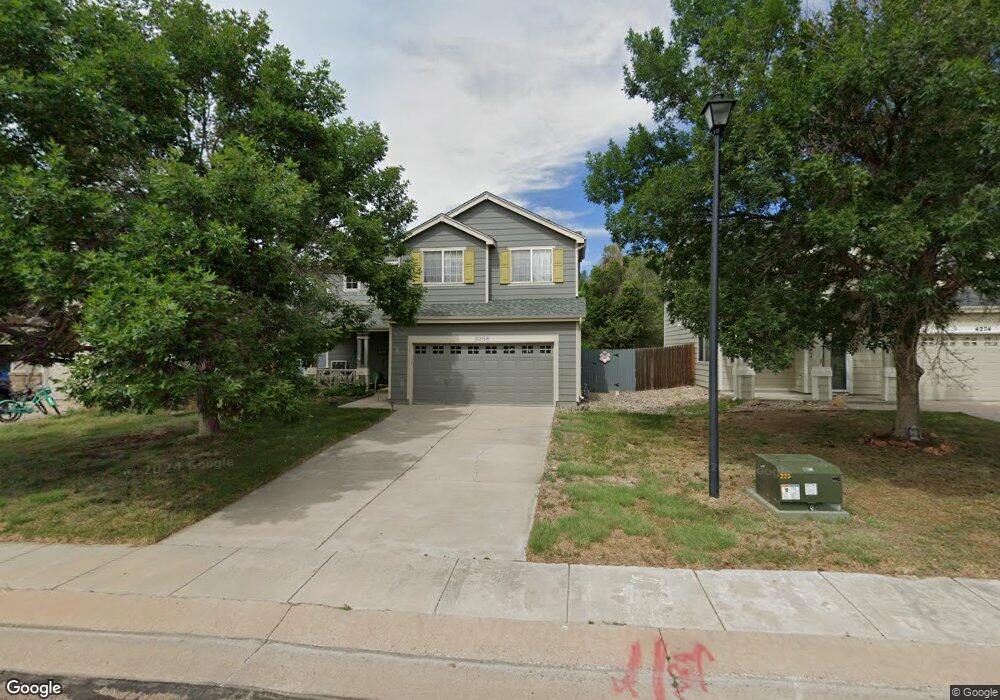
4268 Gunbarrel Dr Colorado Springs, CO 80925
Colorado Centre NeighborhoodEstimated Value: $363,000 - $399,000
3
Beds
3
Baths
1,439
Sq Ft
$266/Sq Ft
Est. Value
About This Home
This home is located at 4268 Gunbarrel Dr, Colorado Springs, CO 80925 and is currently estimated at $383,131, approximately $266 per square foot. 4268 Gunbarrel Dr is a home located in El Paso County with nearby schools including Martin Luther King Jr. Elementary School, Watson Junior High School, and Widefield High School.
Ownership History
Date
Name
Owned For
Owner Type
Purchase Details
Closed on
Feb 6, 2013
Sold by
Sands David A and Sands Kyleah L
Bought by
Cressman Beverly
Current Estimated Value
Purchase Details
Closed on
Aug 17, 2009
Sold by
Sands David A
Bought by
Sands David A and Sands Kyleah L
Purchase Details
Closed on
Mar 21, 2003
Sold by
Hoylman Jared K and Stroupe Sabrina L
Bought by
Sands David A
Home Financials for this Owner
Home Financials are based on the most recent Mortgage that was taken out on this home.
Original Mortgage
$149,651
Interest Rate
5.83%
Mortgage Type
FHA
Purchase Details
Closed on
May 1, 2001
Sold by
Richmond American Homes Of Colorado Inc
Bought by
Hoylman Jared K and Stroupe Sabrina L
Home Financials for this Owner
Home Financials are based on the most recent Mortgage that was taken out on this home.
Original Mortgage
$140,528
Interest Rate
7.1%
Mortgage Type
FHA
Create a Home Valuation Report for This Property
The Home Valuation Report is an in-depth analysis detailing your home's value as well as a comparison with similar homes in the area
Home Values in the Area
Average Home Value in this Area
Purchase History
| Date | Buyer | Sale Price | Title Company |
|---|---|---|---|
| Cressman Beverly | $138,500 | Empire Title Co Springs Llc | |
| Sands David A | -- | Stewart Title | |
| Sands David A | $152,000 | First American | |
| Hoylman Jared K | $142,735 | Stewart Title |
Source: Public Records
Mortgage History
| Date | Status | Borrower | Loan Amount |
|---|---|---|---|
| Previous Owner | Sands David A | $149,651 | |
| Previous Owner | Hoylman Jared K | $140,528 |
Source: Public Records
Tax History Compared to Growth
Tax History
| Year | Tax Paid | Tax Assessment Tax Assessment Total Assessment is a certain percentage of the fair market value that is determined by local assessors to be the total taxable value of land and additions on the property. | Land | Improvement |
|---|---|---|---|---|
| 2025 | $1,738 | $24,730 | -- | -- |
| 2024 | $1,603 | $25,600 | $5,090 | $20,510 |
| 2023 | $1,603 | $25,600 | $5,090 | $20,510 |
| 2022 | $1,364 | $17,620 | $3,500 | $14,120 |
| 2021 | $1,470 | $18,130 | $3,600 | $14,530 |
| 2020 | $1,267 | $14,260 | $3,150 | $11,110 |
| 2019 | $1,261 | $14,260 | $3,150 | $11,110 |
| 2018 | $1,134 | $12,150 | $2,020 | $10,130 |
| 2017 | $1,146 | $12,150 | $2,020 | $10,130 |
| 2016 | $966 | $12,290 | $1,990 | $10,300 |
| 2015 | $988 | $12,290 | $1,990 | $10,300 |
| 2014 | $933 | $11,690 | $1,990 | $9,700 |
Source: Public Records
Map
Nearby Homes
- 4548 Bramble Ln
- 9384 Pony Gulch Way
- 9208 Granger Ln
- 4380 Gunbarrel Dr
- 4386 Gunbarrel Dr
- 4512 Bramble Ln
- 9558 Yukon Way
- 4421 Horizonpoint Dr
- 4332 Levi Ln
- 4404 Bramble Ln
- 9630 Yukon Way
- 4555 Settlement Way
- 9328 Chieftan Dr
- 4806 Truscott Rd
- Cimarron | Residence 39102 Plan at Bradley Heights
- Ontario | Residence 39205 Plan at Bradley Heights
- Livingston | Residence 39103 Plan at Bradley Heights
- Powell | Residence 39206 Plan at Bradley Heights
- Frisco | Residence 39204 Plan at Bradley Heights
- Arcadia Plan at Meadoworks - Trinity Series
- 4274 Gunbarrel Dr
- 4262 Gunbarrel Dr
- 4256 Gunbarrel Dr
- 4280 Gunbarrel Dr
- 9308 Jackrabbit Ln
- 4250 Gunbarrel Dr
- 4286 Gunbarrel Dr
- 4255 Gunbarrel Dr
- 4292 Gunbarrel Dr
- 4244 Gunbarrel Dr
- 9313 Pony Gulch Way
- 9316 Jackrabbit Ln
- 4249 Gunbarrel Dr
- 4525 Levi Ln
- 9327 Pony Gulch Way
- 4243 Gunbarrel Dr
- 4298 Gunbarrel Dr
- 4238 Gunbarrel Dr
- 4521 Levi Ln
- 9324 Jackrabbit Ln