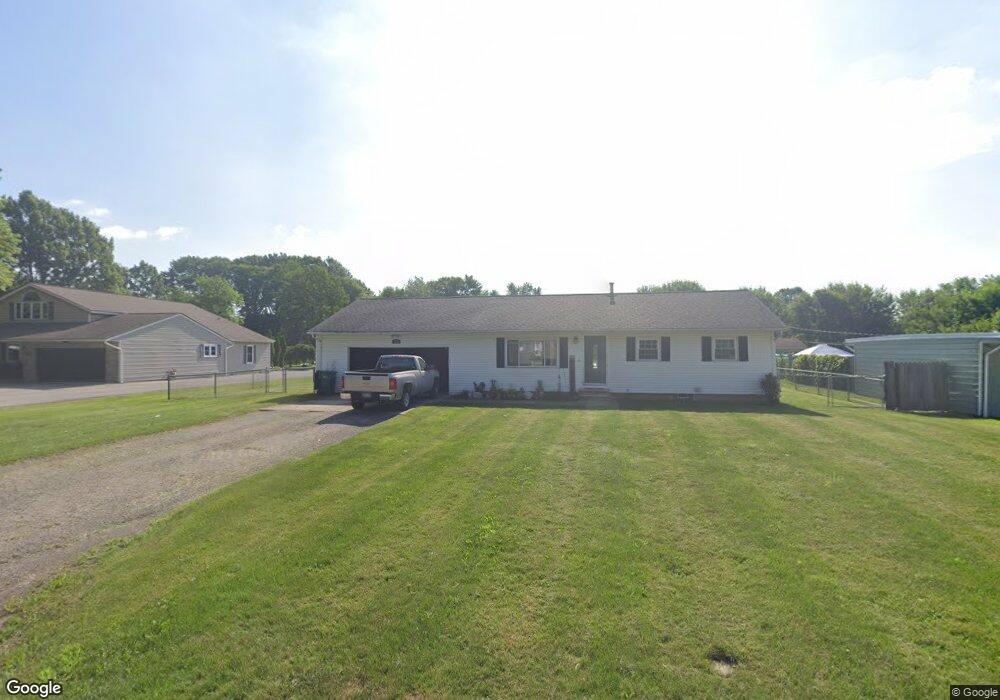
4268 Jermoore Rd Obetz, OH 43207
Obetz-Lockbourne NeighborhoodEstimated Value: $212,000 - $241,000
3
Beds
1
Bath
1,064
Sq Ft
$218/Sq Ft
Est. Value
About This Home
This home is located at 4268 Jermoore Rd, Obetz, OH 43207 and is currently estimated at $231,693, approximately $217 per square foot. 4268 Jermoore Rd is a home located in Franklin County with nearby schools including Groveport Madison High School, South Columbus Preparatory Academy at Southfield, and South Scioto Academy.
Ownership History
Date
Name
Owned For
Owner Type
Purchase Details
Closed on
Apr 4, 2019
Sold by
Williams April L and Williams Family Revocable Living
Bought by
Charles Gregory C
Current Estimated Value
Home Financials for this Owner
Home Financials are based on the most recent Mortgage that was taken out on this home.
Original Mortgage
$86,330
Outstanding Balance
$74,917
Interest Rate
4.08%
Estimated Equity
$156,776
Purchase Details
Closed on
Nov 20, 2010
Sold by
Williams Charles H and Williams April L
Bought by
Williams Charles H and Williams April L
Purchase Details
Closed on
Oct 29, 1992
Bought by
Williams Charles H
Create a Home Valuation Report for This Property
The Home Valuation Report is an in-depth analysis detailing your home's value as well as a comparison with similar homes in the area
Home Values in the Area
Average Home Value in this Area
Purchase History
| Date | Buyer | Sale Price | Title Company |
|---|---|---|---|
| Charles Gregory C | $89,000 | -- | |
| Williams Charles H | -- | None Available | |
| Williams Charles H | -- | -- |
Source: Public Records
Mortgage History
| Date | Status | Borrower | Loan Amount |
|---|---|---|---|
| Open | Charles Gregory C | $86,330 | |
| Closed | Charles Gregory C | -- |
Source: Public Records
Tax History
| Year | Tax Paid | Tax Assessment Tax Assessment Total Assessment is a certain percentage of the fair market value that is determined by local assessors to be the total taxable value of land and additions on the property. | Land | Improvement |
|---|---|---|---|---|
| 2025 | $3,860 | $75,640 | $30,660 | $44,980 |
| 2024 | $3,860 | $75,640 | $30,660 | $44,980 |
| 2023 | $3,823 | $75,635 | $30,660 | $44,975 |
| 2022 | $2,421 | $38,050 | $10,260 | $27,790 |
| 2021 | $2,428 | $38,050 | $10,260 | $27,790 |
| 2020 | $2,433 | $38,050 | $10,260 | $27,790 |
| 2019 | $2,228 | $30,600 | $8,230 | $22,370 |
| 2018 | $1,127 | $30,600 | $8,230 | $22,370 |
| 2017 | $1,637 | $30,600 | $8,230 | $22,370 |
| 2016 | $2,124 | $27,450 | $7,040 | $20,410 |
| 2015 | $322 | $27,450 | $7,040 | $20,410 |
| 2014 | $1,389 | $27,450 | $7,040 | $20,410 |
| 2013 | $684 | $30,485 | $7,805 | $22,680 |
Source: Public Records
Map
Nearby Homes
- 4310 Charlotte Rd
- 2366 E Howard Rd
- 2291 E Howard Rd
- 2535 Bridlewood Ct
- 4142 Oldentime Ct
- 3847 Pendent Ln
- 3768 Pendent Ln
- 1670 Marshall Ave
- 3950 Wintercress Ct
- 1722 Obetz Ave
- 3782 Willowtree Ln
- 1710 Obetz Ave
- 3939 Marsha Dr
- 2629 Patrick Henry Ave Unit 40
- 1583 Metcalfe Ave
- 3688 Tea Party Place Unit 273
- 1632 Marlboro Ave
- 1559 Obetz Ave
- 3415 Southfield Dr E
- 3516 Meadow Valley St
- 4290 Jermoore Rd
- 4250 Jermoore Rd
- 4296 Jermoore Rd
- 4308 Jermoore Rd
- 4267 Jermoore Rd
- 2318 Rodger Rd
- 4285 Jermoore Rd
- 2306 Rodger Rd
- 4314 Jermoore Rd
- 4299 Jermoore Rd
- 2343 Maureen Blvd
- 2307 Maureen Blvd S
- 2277 Rodger Rd
- 4315 Jermoore Rd
- 2351 Maureen Blvd S
- 2295 Maureen Blvd S
- 4330 Jermoore Rd
- 2288 Rodger Rd Unit 292
- 2285 Rodger Rd
- 4270 Ethel Rd
Your Personal Tour Guide
Ask me questions while you tour the home.