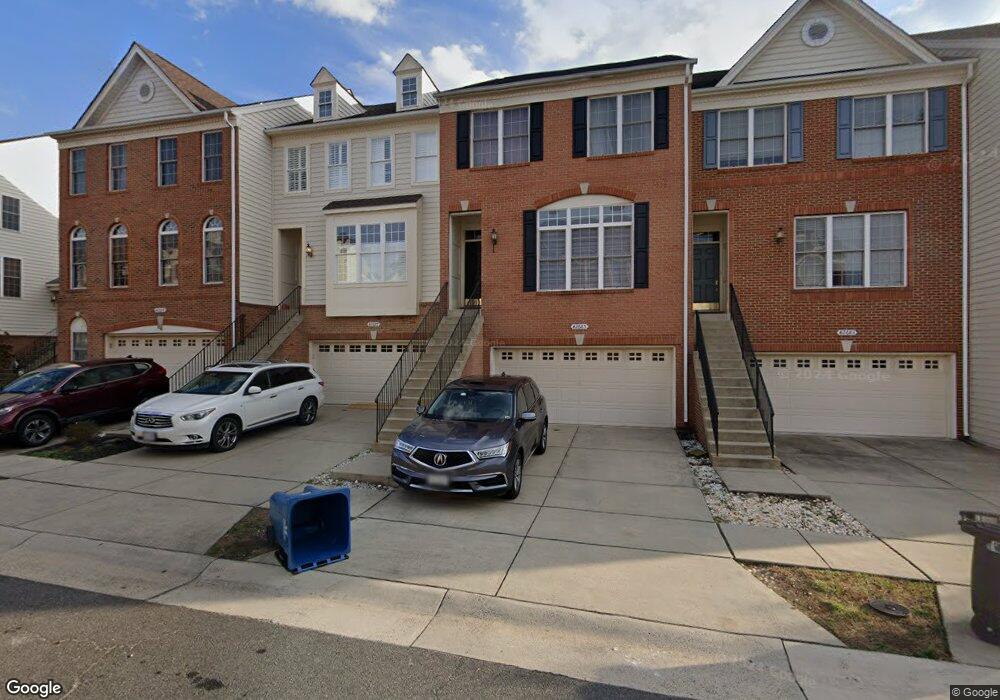
42685 Sandman Terrace Chantilly, VA 20152
Estimated Value: $695,000 - $724,000
3
Beds
4
Baths
2,694
Sq Ft
$265/Sq Ft
Est. Value
About This Home
This home is located at 42685 Sandman Terrace, Chantilly, VA 20152 and is currently estimated at $714,083, approximately $265 per square foot. 42685 Sandman Terrace is a home located in Loudoun County with nearby schools including Liberty Elementary School, J. Michael Lunsford Middle School, and Freedom High School.
Ownership History
Date
Name
Owned For
Owner Type
Purchase Details
Closed on
Apr 29, 2004
Sold by
South Riding L P
Bought by
Min Kyoung
Current Estimated Value
Home Financials for this Owner
Home Financials are based on the most recent Mortgage that was taken out on this home.
Original Mortgage
$281,650
Outstanding Balance
$130,752
Interest Rate
5.36%
Mortgage Type
New Conventional
Estimated Equity
$583,331
Create a Home Valuation Report for This Property
The Home Valuation Report is an in-depth analysis detailing your home's value as well as a comparison with similar homes in the area
Home Values in the Area
Average Home Value in this Area
Purchase History
| Date | Buyer | Sale Price | Title Company |
|---|---|---|---|
| Min Kyoung | $352,000 | -- |
Source: Public Records
Mortgage History
| Date | Status | Borrower | Loan Amount |
|---|---|---|---|
| Open | Min Kyoung | $281,650 |
Source: Public Records
Tax History Compared to Growth
Tax History
| Year | Tax Paid | Tax Assessment Tax Assessment Total Assessment is a certain percentage of the fair market value that is determined by local assessors to be the total taxable value of land and additions on the property. | Land | Improvement |
|---|---|---|---|---|
| 2025 | $5,479 | $680,660 | $215,000 | $465,660 |
| 2024 | $5,584 | $645,600 | $200,000 | $445,600 |
| 2023 | $5,157 | $589,330 | $200,000 | $389,330 |
| 2022 | $5,138 | $577,290 | $190,000 | $387,290 |
| 2021 | $5,031 | $513,390 | $155,000 | $358,390 |
| 2020 | $4,870 | $470,550 | $135,000 | $335,550 |
| 2019 | $4,664 | $446,320 | $135,000 | $311,320 |
| 2018 | $4,701 | $433,240 | $125,000 | $308,240 |
| 2017 | $4,659 | $414,120 | $125,000 | $289,120 |
| 2016 | $4,611 | $402,670 | $0 | $0 |
| 2015 | $4,645 | $284,220 | $0 | $284,220 |
| 2014 | $4,764 | $297,510 | $0 | $297,510 |
Source: Public Records
Map
Nearby Homes
- 25416 Carrington Dr
- 42790 Sykes Terrace
- 42768 Kearney Terrace
- 25304 Shipley Terrace
- 42799 Sykes Terrace
- 25065 Riding Center Dr
- 42791 Flannigan Terrace
- 42643 Homefront Terrace
- 25390 Shipley Terrace
- 25167 Femoyer Terrace
- 25466 Chambers Dr
- 25304 Whippoorwill Terrace
- 42828 Nations St
- 25202 Justice Dr
- 42835 Shaler St
- 24958 Brookbark Terrace
- 43017 Beachall St
- 0 Nethers Rd Unit VARP2001570
- 42289 Magistrate Ct
- 24994 White Fir Ct
- 42687 Sandman Terrace
- 42689 Sandman Terrace
- 42681 Sandman Terrace
- 25296 Nesting Square
- 42693 Sandman Terrace
- 25294 Nesting Square
- 25298 Nesting Square
- 25292 Nesting Square
- 25300 Nesting Square
- 42695 Sandman Terrace
- 42684 Sandman Terrace
- 25304 Nesting Square
- 42686 Sandman Terrace
- 42682 Sandman Terrace
- 42688 Sandman Terrace
- 42680 Sandman Terrace
- 42697 Sandman Terrace
- 25306 Nesting Square
- 42692 Sandman Terrace
- 25273 Nesting Square