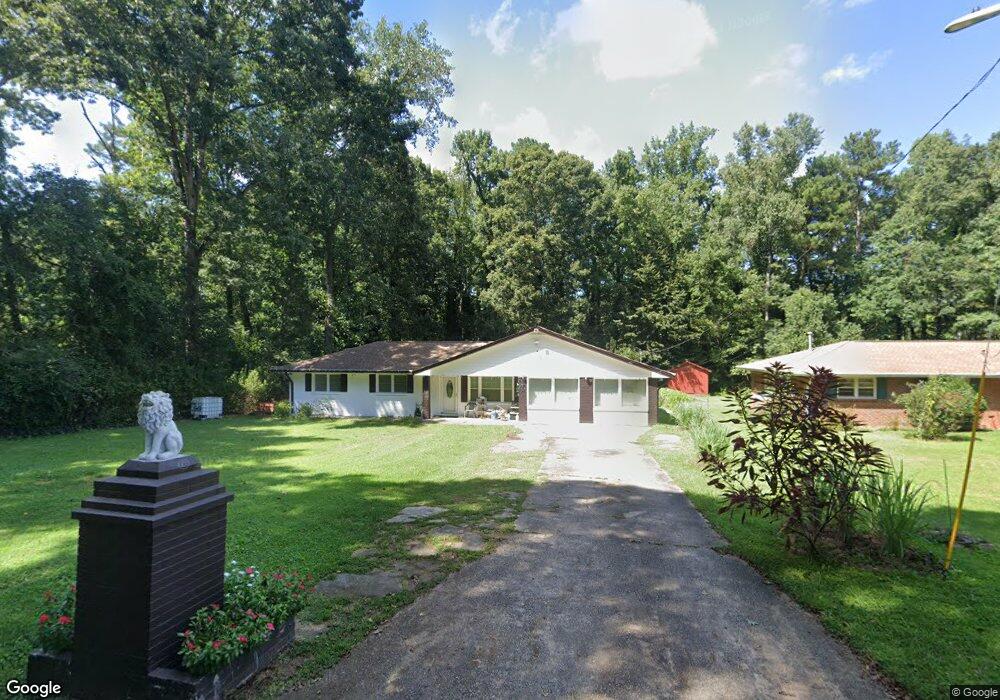
4269 Beaver Ruin Cir NW Lilburn, GA 30047
Estimated Value: $294,000 - $326,000
4
Beds
3
Baths
1,410
Sq Ft
$219/Sq Ft
Est. Value
About This Home
This home is located at 4269 Beaver Ruin Cir NW, Lilburn, GA 30047 and is currently estimated at $309,182, approximately $219 per square foot. 4269 Beaver Ruin Cir NW is a home located in Gwinnett County with nearby schools including Hopkins Elementary School, Berkmar Middle School, and Berkmar High School.
Ownership History
Date
Name
Owned For
Owner Type
Purchase Details
Closed on
Jun 6, 2011
Sold by
Dang Ho P
Bought by
Dang Ho P and Dang Theresa H
Current Estimated Value
Purchase Details
Closed on
May 19, 2011
Sold by
Us Bank Na 2007-2
Bought by
Dang Ho P
Purchase Details
Closed on
Jan 4, 2011
Sold by
Tran Tuyet T
Bought by
Us Bank Na Bafc 2007-2
Purchase Details
Closed on
Jan 4, 2002
Sold by
Nguyen Sang M and Nguyen Hong
Bought by
Nguyen Xuan T
Home Financials for this Owner
Home Financials are based on the most recent Mortgage that was taken out on this home.
Original Mortgage
$120,300
Interest Rate
7.08%
Mortgage Type
New Conventional
Purchase Details
Closed on
Aug 22, 2000
Sold by
Brownlee Virginia S
Bought by
Nguyen Sang M and Nguyen Hong
Home Financials for this Owner
Home Financials are based on the most recent Mortgage that was taken out on this home.
Original Mortgage
$117,800
Interest Rate
8.24%
Mortgage Type
New Conventional
Create a Home Valuation Report for This Property
The Home Valuation Report is an in-depth analysis detailing your home's value as well as a comparison with similar homes in the area
Home Values in the Area
Average Home Value in this Area
Purchase History
| Date | Buyer | Sale Price | Title Company |
|---|---|---|---|
| Dang Ho P | $64,900 | -- | |
| Dang Ho P | $64,900 | -- | |
| Us Bank Na Bafc 2007-2 | -- | -- | |
| Nguyen Xuan T | $126,700 | -- | |
| Nguyen Sang M | $124,000 | -- |
Source: Public Records
Mortgage History
| Date | Status | Borrower | Loan Amount |
|---|---|---|---|
| Previous Owner | Nguyen Xuan T | $120,300 | |
| Previous Owner | Nguyen Sang M | $117,800 |
Source: Public Records
Tax History Compared to Growth
Tax History
| Year | Tax Paid | Tax Assessment Tax Assessment Total Assessment is a certain percentage of the fair market value that is determined by local assessors to be the total taxable value of land and additions on the property. | Land | Improvement |
|---|---|---|---|---|
| 2024 | $3,182 | $106,680 | $21,120 | $85,560 |
| 2023 | $3,182 | $72,880 | $16,000 | $56,880 |
| 2022 | $2,442 | $72,880 | $16,000 | $56,880 |
| 2021 | $1,929 | $50,280 | $16,000 | $34,280 |
| 2020 | $1,939 | $50,280 | $16,000 | $34,280 |
| 2019 | $1,881 | $54,040 | $10,000 | $44,040 |
| 2018 | $2,009 | $54,040 | $10,000 | $44,040 |
| 2016 | $1,047 | $25,960 | $13,880 | $12,080 |
| 2015 | $1,056 | $25,960 | $13,880 | $12,080 |
| 2014 | $1,060 | $25,960 | $13,880 | $12,080 |
Source: Public Records
Map
Nearby Homes
- 566 Jody Place
- 0 Lawrenceville Hwy NW Unit 7662367
- 0 Lawrenceville Hwy NW Unit 10618125
- 4100 Bradstone Trace NW Unit 1
- 3975 Bradstone Trace NW
- 4082 Johns St NW
- 642 Huntington Way NW
- 4450 Bradstone Trace NW Unit 2
- 4452 Burns Rd NW
- 4596 Mossy Ln NW Unit 1
- 4474 Casco Ln NW
- 3951 Millwood Ln NW
- 4080 Landress Park Dr NW Unit 1
- 3911 Millwood Ln NW
- 237 Sandra Dr NW
- 881 Huntington Way NW
- 217 Sandra Dr NW Unit 4
- 1052 Rabun Dr NW Unit 2
- 4259 Beaver Ruin Cir NW
- 4249 Beaver Ruin Cir NW
- 542 Dogwood Dr NW
- 552 Dogwood Dr NW Unit 12
- 552 Dogwood Dr NW
- 536 Dogwood Dr NW
- 4262 Jody Ln NW
- 0 Beaver Ruin Cir NW Unit 7056907
- 0 Beaver Ruin Cir NW Unit 8370535
- 0 Beaver Ruin Cir NW Unit 8353397
- 0 Beaver Ruin Cir NW Unit 8214031
- 0 Beaver Ruin Cir NW
- 0 Dogwood Dr NW
- 4229 Beaver Ruin Cir NW
- 4239 Beaver Ruin Cir NW
- 532 Dogwood Dr NW
- 4252 Jody Ln NW
- 562 Dogwood Dr NW
- 4237 Beaver Ruin Cir NW
- 4229 Beaver Ruin Ct NW