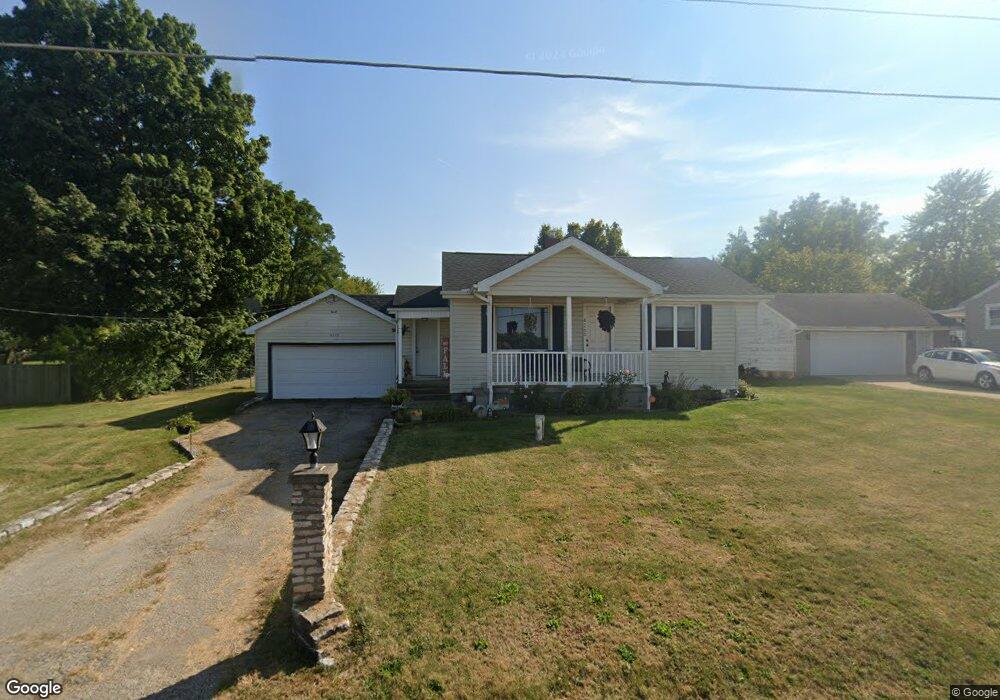
4269 Detrick Jordan Pike Springfield, OH 45502
Estimated Value: $170,000 - $199,000
3
Beds
1
Bath
1,068
Sq Ft
$170/Sq Ft
Est. Value
About This Home
This home is located at 4269 Detrick Jordan Pike, Springfield, OH 45502 and is currently estimated at $181,927, approximately $170 per square foot. 4269 Detrick Jordan Pike is a home located in Clark County with nearby schools including Northwestern Elementary School and Northwestern Junior/Senior High School.
Ownership History
Date
Name
Owned For
Owner Type
Purchase Details
Closed on
Apr 27, 2015
Sold by
Drake Brittany N
Bought by
Bevan Kyle and Bevan Kyle J
Current Estimated Value
Purchase Details
Closed on
Oct 3, 2012
Sold by
Arthur Angela M and Fleming Angela M
Bought by
Bevan Kyle J and Drake Brittany N
Home Financials for this Owner
Home Financials are based on the most recent Mortgage that was taken out on this home.
Original Mortgage
$79,039
Interest Rate
3.37%
Mortgage Type
FHA
Purchase Details
Closed on
Aug 12, 2005
Sold by
Estate Of Brian D Fleming
Bought by
Fleming Angela M and Sommers Angela M
Purchase Details
Closed on
Jul 2, 1996
Sold by
Cotterman Thomas
Bought by
Sommers Brian D Fleming and Sommers Angela M
Home Financials for this Owner
Home Financials are based on the most recent Mortgage that was taken out on this home.
Original Mortgage
$84,455
Interest Rate
8.13%
Mortgage Type
New Conventional
Create a Home Valuation Report for This Property
The Home Valuation Report is an in-depth analysis detailing your home's value as well as a comparison with similar homes in the area
Home Values in the Area
Average Home Value in this Area
Purchase History
| Date | Buyer | Sale Price | Title Company |
|---|---|---|---|
| Bevan Kyle | -- | Attorney | |
| Bevan Kyle J | $80,500 | None Available | |
| Fleming Angela M | -- | -- | |
| Sommers Brian D Fleming | $88,900 | -- |
Source: Public Records
Mortgage History
| Date | Status | Borrower | Loan Amount |
|---|---|---|---|
| Previous Owner | Bevan Kyle J | $79,039 | |
| Previous Owner | Sommers Brian D Fleming | $84,455 |
Source: Public Records
Tax History Compared to Growth
Tax History
| Year | Tax Paid | Tax Assessment Tax Assessment Total Assessment is a certain percentage of the fair market value that is determined by local assessors to be the total taxable value of land and additions on the property. | Land | Improvement |
|---|---|---|---|---|
| 2024 | $1,917 | $41,970 | $9,820 | $32,150 |
| 2023 | $1,917 | $41,970 | $9,820 | $32,150 |
| 2022 | $1,970 | $41,970 | $9,820 | $32,150 |
| 2021 | $1,710 | $32,380 | $7,500 | $24,880 |
| 2020 | $1,727 | $32,380 | $7,500 | $24,880 |
| 2019 | $1,711 | $32,380 | $7,500 | $24,880 |
| 2018 | $1,478 | $27,490 | $6,820 | $20,670 |
| 2017 | $1,478 | $27,493 | $6,818 | $20,675 |
| 2016 | $1,449 | $27,493 | $6,818 | $20,675 |
| 2015 | $1,426 | $27,080 | $6,818 | $20,262 |
| 2014 | $1,425 | $27,080 | $6,818 | $20,262 |
| 2013 | $1,416 | $27,080 | $6,818 | $20,262 |
Source: Public Records
Map
Nearby Homes
- 17 Sunset Dr
- 2100 Manhattan Blvd
- 2137 Manhattan Blvd
- 2558 Stoney Creek St
- 2036 Troy Rd
- 323 Saint Paul Ave
- 2639 Anita Dr
- 4461 New Carlisle Pike
- 925 Spruce Dr
- 224 E Downey Dr
- 570 Aberfelda Dr
- 1101 Spruce Dr
- 245 Gordon Rd
- 5171 New Carlisle Pike
- 3721 W National Rd
- 2805 Cottonwood Dr
- 201 Beech Dr
- 6439 Greenridge Ave
- 4253 Detrick Jordan Pike
- 4285 Detrick Jordan Pike
- 4235 Detrick Jordan Pike
- 4303 Detrick Jordan Pike
- 4280 Evans Ave
- 4219 Detrick Jordan Pike
- 1622 N Star Dr
- 4201 Detrick Jordan Pike
- 4337 Detrick Jordan Pike
- 1596 N Star St
- 1585 N Star Dr
- 4357 Detrick Jordan Pike
- 1596 N Star Dr
- 4344 Evans Ave
- 1621 Shrine Rd
- 1601 Shrine Rd
- 4371 Detrick Jordan Pike
- 4325 Evans Ave
- 1572 N Star Dr
- 4383 Detrick Jordan Pike