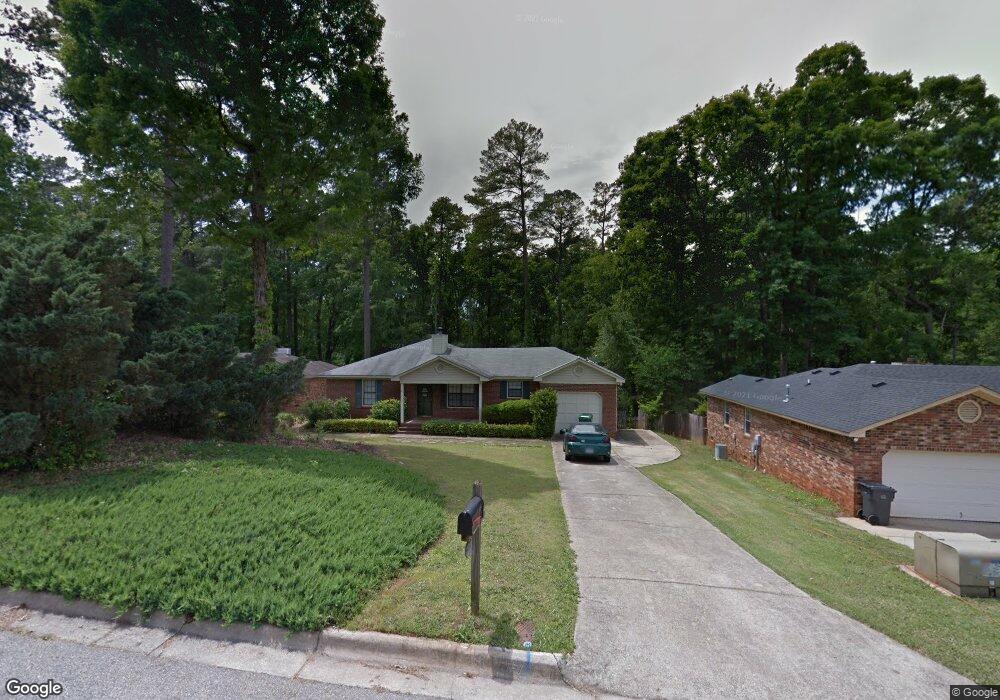
4269 Waylon Dr Augusta, GA 30907
Estimated Value: $227,000 - $276,000
4
Beds
2
Baths
1,544
Sq Ft
$158/Sq Ft
Est. Value
About This Home
This home is located at 4269 Waylon Dr, Augusta, GA 30907 and is currently estimated at $244,661, approximately $158 per square foot. 4269 Waylon Dr is a home located in Columbia County with nearby schools including Martinez Elementary School, Westmont Elementary School, and Evans Middle School.
Ownership History
Date
Name
Owned For
Owner Type
Purchase Details
Closed on
Aug 1, 2018
Sold by
S
Bought by
Sanders Thomas C
Current Estimated Value
Purchase Details
Closed on
Mar 22, 2013
Sold by
Sanders Thomas
Bought by
S & S Holding Grp Llc
Purchase Details
Closed on
Aug 2, 2011
Sold by
Bac Home Loans Servicing L
Bought by
Sec Of Housing & Urban
Purchase Details
Closed on
Dec 27, 2007
Sold by
Wolfe Victor G
Bought by
Crawford Scott
Home Financials for this Owner
Home Financials are based on the most recent Mortgage that was taken out on this home.
Original Mortgage
$131,528
Interest Rate
6.05%
Mortgage Type
New Conventional
Purchase Details
Closed on
Nov 18, 2005
Sold by
Adams Terri
Bought by
Wolfe Victor G and Nicole Wolfe V
Home Financials for this Owner
Home Financials are based on the most recent Mortgage that was taken out on this home.
Original Mortgage
$138,311
Interest Rate
6.04%
Mortgage Type
VA
Create a Home Valuation Report for This Property
The Home Valuation Report is an in-depth analysis detailing your home's value as well as a comparison with similar homes in the area
Home Values in the Area
Average Home Value in this Area
Purchase History
| Date | Buyer | Sale Price | Title Company |
|---|---|---|---|
| Sanders Thomas C | -- | -- | |
| S & S Holding Grp Llc | -- | -- | |
| Sec Of Housing & Urban | $113,500 | -- | |
| Bac Home Loan Servicing Lp | $113,500 | -- | |
| Crawford Scott | $138,500 | -- | |
| Wolfe Victor G | $135,400 | -- |
Source: Public Records
Mortgage History
| Date | Status | Borrower | Loan Amount |
|---|---|---|---|
| Previous Owner | Crawford Scott | $131,528 | |
| Previous Owner | Wolfe Victor G | $138,311 |
Source: Public Records
Tax History Compared to Growth
Tax History
| Year | Tax Paid | Tax Assessment Tax Assessment Total Assessment is a certain percentage of the fair market value that is determined by local assessors to be the total taxable value of land and additions on the property. | Land | Improvement |
|---|---|---|---|---|
| 2025 | $2,402 | $98,241 | $16,764 | $81,477 |
| 2024 | $2,543 | $99,420 | $17,524 | $81,896 |
| 2023 | $2,543 | $81,342 | $15,434 | $65,908 |
| 2022 | $1,990 | $74,303 | $14,009 | $60,294 |
| 2021 | $1,867 | $66,495 | $11,919 | $54,576 |
| 2020 | $1,815 | $63,262 | $11,064 | $52,198 |
| 2019 | $1,651 | $57,340 | $11,254 | $46,086 |
| 2018 | $1,522 | $52,503 | $10,019 | $42,484 |
| 2017 | $1,628 | $56,144 | $9,924 | $46,220 |
| 2016 | $1,401 | $49,790 | $9,900 | $39,890 |
| 2015 | $1,313 | $46,440 | $8,950 | $37,490 |
| 2014 | $1,309 | $45,698 | $9,235 | $36,463 |
Source: Public Records
Map
Nearby Homes
- 114 W Lynne Dr
- 155 Ashbyrne Dr
- 108 Morehead Dr
- 4355 Columbia Rd
- 174 Creek View Ct
- 103 Dresden Dr
- 226 Ashley Cir
- 4134 Allison Rd
- 104 Moss Creek Dr
- 4425 Branchwood Dr
- 108 Whetstone Ct
- 4129 Allison Rd
- 149 Woodland Dr
- 126 Moss Creek Dr
- 228 Woodland Dr
- 102 Cokesbury Ct
- 222 Oakridge Dr
- 126 Wood Creek Dr
- 4045 Dowling Dr
- 4222 Green Ivy Cir
- 4267 Waylon Dr
- 4271 Waylon Dr
- 4265 Waylon Dr
- 4273 Waylon Dr
- 4278 Waylon Dr
- 4276 Waylon Dr
- 4263 Waylon Dr
- 4280 Waylon Dr
- 4275 Waylon Dr
- 4274 Waylon Ct
- 4260 Waylon Ct
- 4261 Waylon Dr
- 4360 Roswell Dr
- 4362 Roswell Dr
- 4272 Waylon Ct
- 4262 Waylon Ct
- 4358 Roswell Dr
- 4258 Waylon Dr
- 4364 Roswell Dr
- 4356 Roswell Dr