Estimated Value: $236,000 - $295,491
5
Beds
2
Baths
2,560
Sq Ft
$102/Sq Ft
Est. Value
About This Home
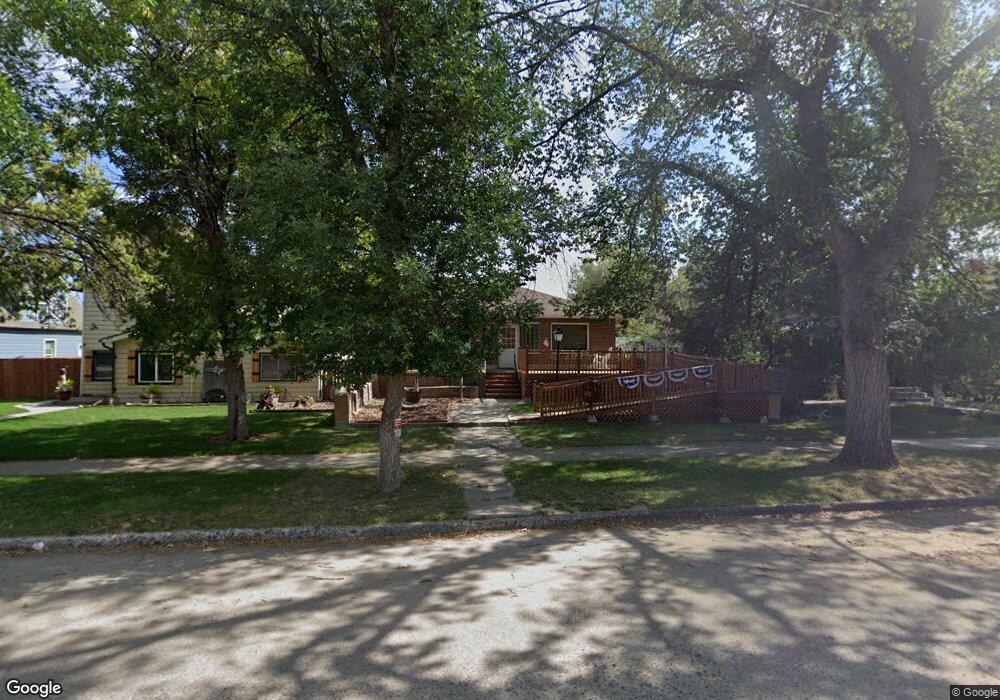
This home is located at 427 3rd Ave, Havre, MT 59501 and is currently estimated at $260,873, approximately $101 per square foot. 427 3rd Ave is a home located in Hill County with nearby schools including Highland Park Early Primary School, Lincoln-McKinley School, and Sunnyside School.
Ownership History
Date
Name
Owned For
Owner Type
Purchase Details
Closed on
Apr 4, 2012
Sold by
Rice Robert E and Rice Dorothy G
Bought by
Rice Robert E
Current Estimated Value
Purchase Details
Closed on
Apr 2, 2012
Sold by
Rice Robert E and Rice Dorothy G
Bought by
Rice Robert E
Create a Home Valuation Report for This Property
The Home Valuation Report is an in-depth analysis detailing your home's value as well as a comparison with similar homes in the area
Purchase History
| Date | Buyer | Sale Price | Title Company |
|---|---|---|---|
| Rice Robert E | -- | -- | |
| Rice Robert E | -- | -- | |
| Rice Robert E | -- | -- |
Source: Public Records
Tax History
| Year | Tax Paid | Tax Assessment Tax Assessment Total Assessment is a certain percentage of the fair market value that is determined by local assessors to be the total taxable value of land and additions on the property. | Land | Improvement |
|---|---|---|---|---|
| 2025 | $2,271 | $273,900 | $0 | $0 |
| 2024 | $2,665 | $214,900 | $0 | $0 |
| 2023 | $2,597 | $230,400 | $0 | $0 |
| 2022 | $2,603 | $213,700 | $0 | $0 |
| 2021 | $2,185 | $213,700 | $0 | $0 |
| 2020 | $2,395 | $190,700 | $0 | $0 |
| 2019 | $2,399 | $190,700 | $0 | $0 |
| 2018 | $2,404 | $186,500 | $0 | $0 |
| 2017 | $2,412 | $186,500 | $0 | $0 |
| 2016 | $2,199 | $167,600 | $0 | $0 |
| 2015 | $1,977 | $167,600 | $0 | $0 |
| 2014 | $1,460 | $71,709 | $0 | $0 |
Source: Public Records
Map
Nearby Homes
Your Personal Tour Guide
Ask me questions while you tour the home.