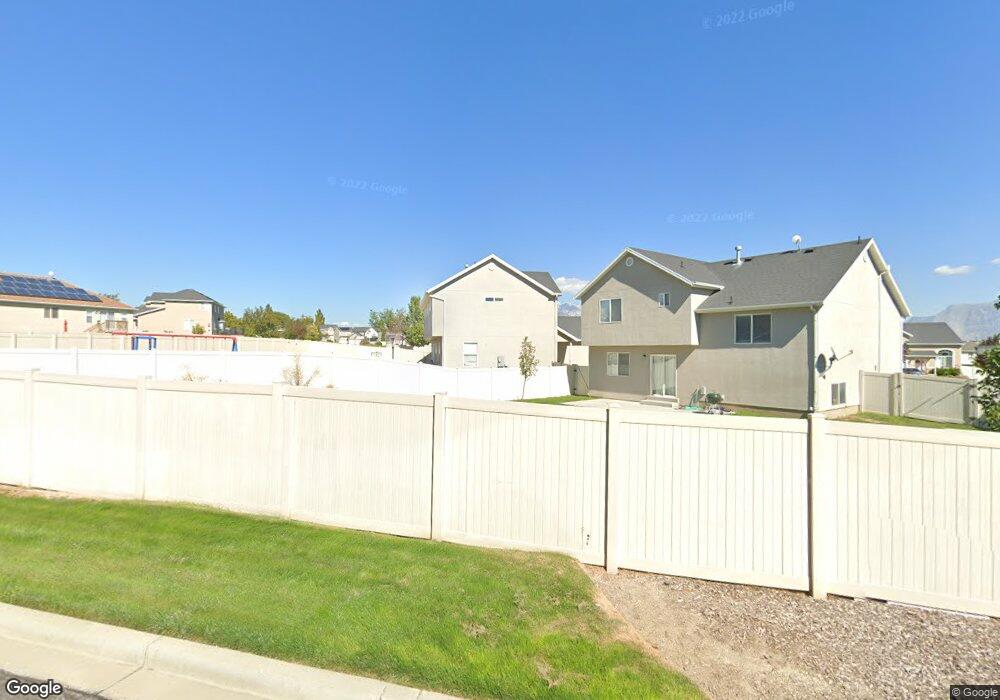
427 Cinnamon Cir Saratoga Springs, UT 84045
Estimated Value: $578,000 - $638,000
4
Beds
3
Baths
2,713
Sq Ft
$220/Sq Ft
Est. Value
About This Home
This home is located at 427 Cinnamon Cir, Saratoga Springs, UT 84045 and is currently estimated at $597,076, approximately $220 per square foot. 427 Cinnamon Cir is a home located in Utah County with nearby schools including Riverview Elementary School, Vista Heights Middle School, and Westlake High School.
Ownership History
Date
Name
Owned For
Owner Type
Purchase Details
Closed on
Sep 3, 2019
Sold by
Wilcken Sharon and Wilcken Preston
Bought by
Wilcken Preston and Wilcken Sharon
Current Estimated Value
Home Financials for this Owner
Home Financials are based on the most recent Mortgage that was taken out on this home.
Original Mortgage
$339,000
Outstanding Balance
$297,544
Interest Rate
3.7%
Estimated Equity
$299,532
Purchase Details
Closed on
May 14, 2008
Sold by
Hill Larena
Bought by
Waite Joshua and Waite Angela
Home Financials for this Owner
Home Financials are based on the most recent Mortgage that was taken out on this home.
Original Mortgage
$237,522
Interest Rate
5.88%
Mortgage Type
FHA
Purchase Details
Closed on
Nov 17, 2005
Sold by
Hill David and Hill Larena
Bought by
Hill Larena
Purchase Details
Closed on
Sep 26, 2003
Sold by
Salisbury Development Lc
Bought by
Hill David and Hill Larena
Create a Home Valuation Report for This Property
The Home Valuation Report is an in-depth analysis detailing your home's value as well as a comparison with similar homes in the area
Home Values in the Area
Average Home Value in this Area
Purchase History
| Date | Buyer | Sale Price | Title Company |
|---|---|---|---|
| Wilcken Preston | -- | Gt Title Services | |
| Waite Joshua | -- | First American Pinehurst | |
| Hill Larena | -- | -- | |
| Hill David | -- | Provo Land Title Co |
Source: Public Records
Mortgage History
| Date | Status | Borrower | Loan Amount |
|---|---|---|---|
| Open | Wilcken Preston | $339,000 | |
| Previous Owner | Waite Joshua | $237,522 |
Source: Public Records
Tax History Compared to Growth
Tax History
| Year | Tax Paid | Tax Assessment Tax Assessment Total Assessment is a certain percentage of the fair market value that is determined by local assessors to be the total taxable value of land and additions on the property. | Land | Improvement |
|---|---|---|---|---|
| 2025 | $2,267 | $528,400 | $204,500 | $323,900 |
| 2024 | $2,267 | $272,305 | $0 | $0 |
| 2023 | $2,179 | $281,490 | $0 | $0 |
| 2022 | $2,423 | $305,250 | $0 | $0 |
| 2021 | $2,102 | $395,200 | $122,200 | $273,000 |
| 2020 | $2,013 | $371,600 | $109,100 | $262,500 |
| 2019 | $1,800 | $344,300 | $101,800 | $242,500 |
| 2018 | $1,695 | $305,800 | $90,900 | $214,900 |
| 2017 | $1,644 | $158,675 | $0 | $0 |
| 2016 | $1,502 | $134,585 | $0 | $0 |
| 2015 | $1,487 | $126,390 | $0 | $0 |
| 2014 | $1,427 | $119,955 | $0 | $0 |
Source: Public Records
Map
Nearby Homes
- 1209 W Mahogany St
- 1974 Trellis Place
- 1526 N Cozy Ln Unit 7
- 1597 N Cozy Ln Unit 14
- 549 W Goldenrod Way
- 624 W Aspen Hills Blvd
- Oak Plan at Dignity Subdivision
- Maple Plan at Dignity Subdivision
- 608 W Domanick Way Unit 1
- 683 W Saratoga Chase Dr
- 178 W Harvest Village Ln
- 597 W Domanick Way Unit 4
- 652 W Pimlico Dr
- 2017 N Belmont Dr
- 736 W Blue Violet Dr
- 1538 N Cozy Ln Unit 6
- 2093 N Morning Star Dr
- 174 W Autumn Ln Unit 138
- 1202 W Autumn Ln Unit 328
- 1526 Charmer Ln
- 427 W Cinnamon Cir
- 425 Cinnamon Cir
- 425 W Cinnamon Cir
- 423 Cinnamon Cir
- 423 W Cinnamon Cir
- 416 W Cinnamon Cir
- 416 Cinnamon Cir
- 1902 Trellis Place
- 421 Cinnamon Cir
- 421 W Cinnamon Cir
- 1903 N Trellis Place
- 1903 Trellis Place
- 410 Cinnamon Cir
- 469 Floribunda Dr
- 410 W Cinnamon Cir
- 1908 N Trellis Place
- 1908 Trellis Place
- 462 Rosemary Place
- 462 Rosemary Place Unit 1320
- 417 Cinnamon Cir