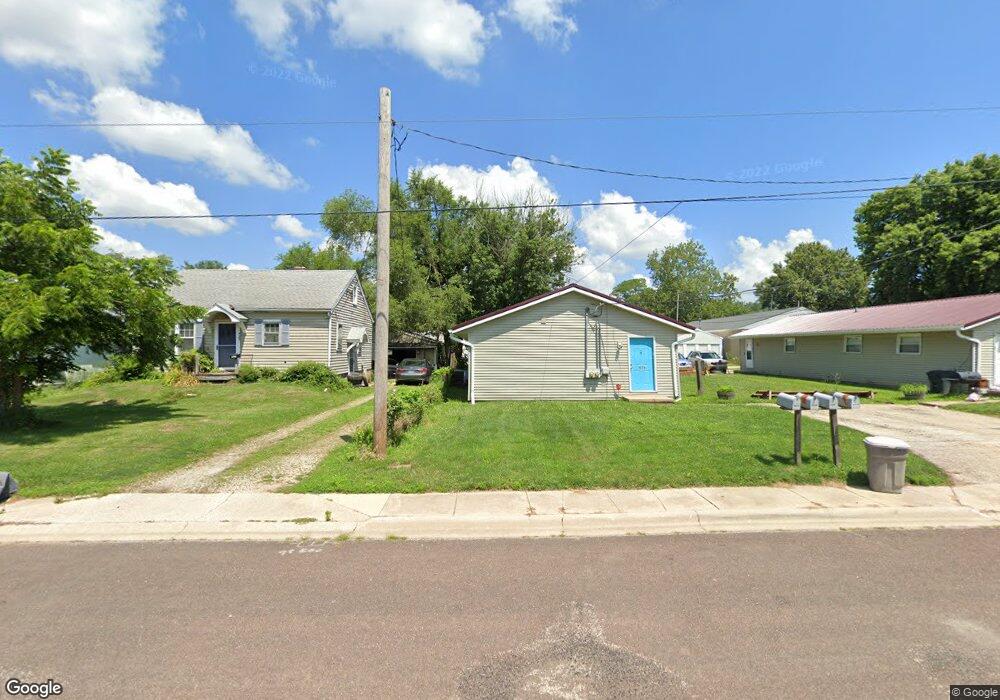
427 E Moneta Ave Unit 4 Peoria Heights, IL 61616
Estimated Value: $156,000 - $278,000
8
Beds
4
Baths
3,016
Sq Ft
$64/Sq Ft
Est. Value
About This Home
This home is located at 427 E Moneta Ave Unit 4, Peoria Heights, IL 61616 and is currently estimated at $194,121, approximately $64 per square foot. 427 E Moneta Ave Unit 4 is a home located in Peoria County with nearby schools including Peoria Heights Grade School, Peoria Heights High School, and St Thomas Catholic School.
Ownership History
Date
Name
Owned For
Owner Type
Purchase Details
Closed on
Nov 30, 2023
Sold by
Sullivan Rental Properties Llc
Bought by
Trujillo Tavera Cristian
Current Estimated Value
Home Financials for this Owner
Home Financials are based on the most recent Mortgage that was taken out on this home.
Original Mortgage
$239,580
Outstanding Balance
$235,157
Interest Rate
6.94%
Mortgage Type
FHA
Estimated Equity
-$41,036
Purchase Details
Closed on
Sep 2, 2022
Sold by
Mayernich Jeffrey V
Bought by
Ullivan Rental Properties Llc
Home Financials for this Owner
Home Financials are based on the most recent Mortgage that was taken out on this home.
Original Mortgage
$172,000
Interest Rate
3.01%
Mortgage Type
New Conventional
Purchase Details
Closed on
Apr 28, 2010
Sold by
Dantone and Dantone Julie F
Bought by
Mayernich Jeffrey
Create a Home Valuation Report for This Property
The Home Valuation Report is an in-depth analysis detailing your home's value as well as a comparison with similar homes in the area
Home Values in the Area
Average Home Value in this Area
Purchase History
| Date | Buyer | Sale Price | Title Company |
|---|---|---|---|
| Trujillo Tavera Cristian | $244,000 | None Listed On Document | |
| Ullivan Rental Properties Llc | $215,000 | -- | |
| Mayernich Jeffrey | $132,500 | Attorney Only | |
| Mayernich Jeffrey | $132,500 | -- |
Source: Public Records
Mortgage History
| Date | Status | Borrower | Loan Amount |
|---|---|---|---|
| Open | Trujillo Tavera Cristian | $239,580 | |
| Previous Owner | Ullivan Rental Properties Llc | $172,000 | |
| Closed | Mayernich Jeffrey | $90,787 |
Source: Public Records
Tax History Compared to Growth
Tax History
| Year | Tax Paid | Tax Assessment Tax Assessment Total Assessment is a certain percentage of the fair market value that is determined by local assessors to be the total taxable value of land and additions on the property. | Land | Improvement |
|---|---|---|---|---|
| 2024 | $3,232 | $37,840 | $4,260 | $33,580 |
| 2023 | $3,111 | $34,720 | $3,910 | $30,810 |
| 2022 | $2,219 | $24,190 | $4,110 | $20,080 |
| 2021 | $1,988 | $21,280 | $3,910 | $17,370 |
| 2020 | $2,031 | $20,860 | $3,830 | $17,030 |
| 2019 | $2,022 | $20,860 | $3,830 | $17,030 |
| 2018 | $1,949 | $20,230 | $3,710 | $16,520 |
| 2017 | $1,967 | $20,650 | $3,790 | $16,860 |
| 2016 | $1,937 | $20,650 | $3,790 | $16,860 |
| 2015 | $1,995 | $20,650 | $3,790 | $16,860 |
| 2014 | $2,019 | $21,500 | $3,650 | $17,850 |
| 2013 | -- | $21,610 | $3,670 | $17,940 |
Source: Public Records
Map
Nearby Homes
- 513 E Moneta Ave
- 4600 N Knoxville Ave
- 801 E Toledo Ave
- 4012 N Boulevard Ave
- 810 E Sciota Ave
- 4021 N Boulevard Ave
- 903 E Lake Ave
- 909 E Moneta Ave
- 4100 N Illinois Ave
- 125 E Glen Ave Unit 111B
- 0 E Moneta Ave
- 3923 N Illinois Ave
- 5014 N Best St
- 4935 N Glenaire Ct
- 1002 E Samuel Ave
- 316 W Knoll Crest Dr
- 209 E Northridge Ln
- 306 W Ivy Ln
- 205 W Glen Ave
- 102 W Crestwood Dr
- 427 E Moneta Ave
- 427 E Moneta Ave
- 425 E Moneta Ave
- 429 E Moneta Ave
- 509 E Moneta Ave
- 506 E Marietta Ave Unit Garage (Re
- 424 E Moneta Ave
- 508 E Marietta Ave
- 506 E Moneta Ave
- 502 E Moneta Ave
- 512 E Marietta Ave
- 412 E Marietta Ave
- 517 E Moneta Ave
- 516 E Marietta Ave
- 406 E Marietta Ave
- 4420 N California Ave
- 521 E Moneta Ave
- 421 E Marietta Ave
- 516 E Moneta Ave
- 429 E Marietta Ave