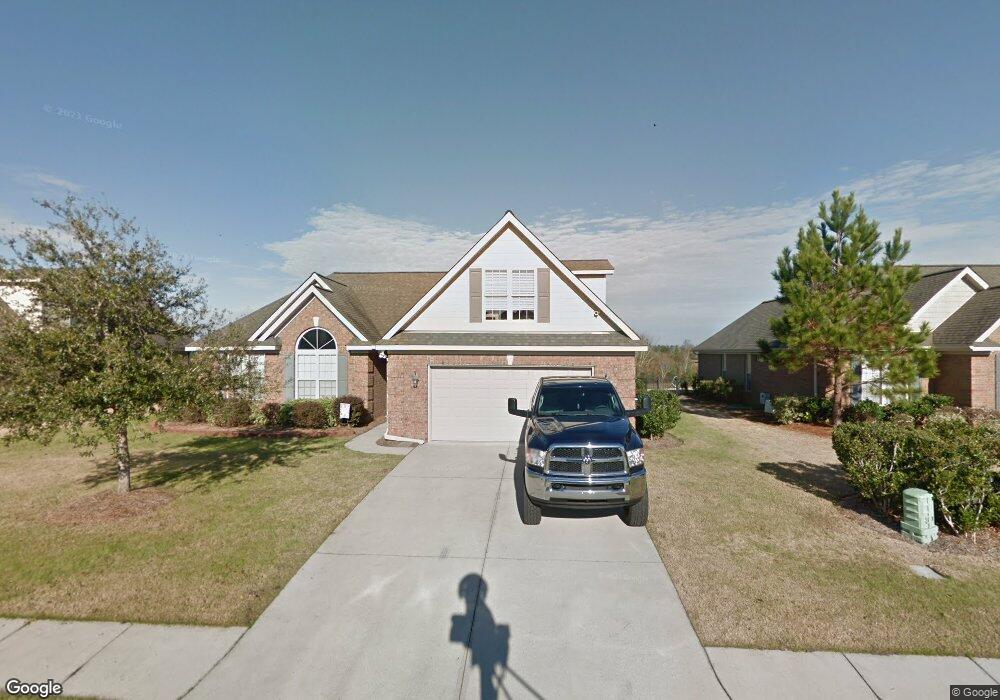
427 Highlands Dr Hampstead, NC 28443
Estimated Value: $410,204 - $481,000
5
Beds
3
Baths
2,471
Sq Ft
$180/Sq Ft
Est. Value
About This Home
This home is located at 427 Highlands Dr, Hampstead, NC 28443 and is currently estimated at $443,801, approximately $179 per square foot. 427 Highlands Dr is a home located in Pender County with nearby schools including South Topsail Elementary School, Topsail Middle School, and Topsail High School.
Ownership History
Date
Name
Owned For
Owner Type
Purchase Details
Closed on
Jun 21, 2017
Sold by
Tallarigo Richard S and Tallarigo Kristin L
Bought by
Melton Michael G and Melton Shelby L
Current Estimated Value
Home Financials for this Owner
Home Financials are based on the most recent Mortgage that was taken out on this home.
Original Mortgage
$237,500
Outstanding Balance
$195,809
Interest Rate
4.05%
Mortgage Type
New Conventional
Estimated Equity
$247,992
Purchase Details
Closed on
Aug 6, 2007
Sold by
Hardison Building Inc
Bought by
Tallarigo Richard S and Tallarigo Kristin L
Home Financials for this Owner
Home Financials are based on the most recent Mortgage that was taken out on this home.
Original Mortgage
$272,000
Interest Rate
5.51%
Mortgage Type
Adjustable Rate Mortgage/ARM
Create a Home Valuation Report for This Property
The Home Valuation Report is an in-depth analysis detailing your home's value as well as a comparison with similar homes in the area
Home Values in the Area
Average Home Value in this Area
Purchase History
| Date | Buyer | Sale Price | Title Company |
|---|---|---|---|
| Melton Michael G | $250,000 | None Available | |
| Tallarigo Richard S | $340,000 | -- |
Source: Public Records
Mortgage History
| Date | Status | Borrower | Loan Amount |
|---|---|---|---|
| Open | Melton Michael G | $237,500 | |
| Previous Owner | Tallarigo Richard S | $272,000 |
Source: Public Records
Tax History
| Year | Tax Paid | Tax Assessment Tax Assessment Total Assessment is a certain percentage of the fair market value that is determined by local assessors to be the total taxable value of land and additions on the property. | Land | Improvement |
|---|---|---|---|---|
| 2025 | $2,439 | $392,414 | $39,848 | $352,566 |
| 2024 | $2,439 | $242,047 | $65,787 | $176,260 |
| 2023 | $2,439 | $242,047 | $65,787 | $176,260 |
| 2022 | $2,125 | $242,047 | $65,787 | $176,260 |
| 2021 | $2,125 | $242,047 | $65,787 | $176,260 |
| 2020 | $2,060 | $234,280 | $65,787 | $168,493 |
| 2019 | $2,060 | $234,280 | $65,787 | $168,493 |
| 2018 | $2,767 | $291,867 | $60,000 | $231,867 |
| 2017 | $2,767 | $291,867 | $60,000 | $231,867 |
| 2016 | $2,737 | $291,867 | $60,000 | $231,867 |
| 2015 | $2,702 | $291,867 | $60,000 | $231,867 |
| 2014 | $2,127 | $291,867 | $60,000 | $231,867 |
| 2013 | -- | $291,867 | $60,000 | $231,867 |
| 2012 | -- | $291,867 | $60,000 | $231,867 |
Source: Public Records
Map
Nearby Homes
- 100 Scotlands Ct
- 35 Scotlands Ct
- 607 Castle Bay Dr
- 41 Windsor Ct
- 502B Castle Bay Dr
- 32 W Pioneer Way Unit 128
- 10 W Pioneer Way Unit 132
- 69 W Pioneer Way Unit 106
- 29 W Pioneer Way Unit 115
- 17 E Pioneer Way Unit 151
- 7 E Pioneer Way Unit 150
- 18 E Pioneer Way Unit 74
- 8 E Pioneer Way Unit 75
- 38 W Farley Dr Unit 96
- 40 W Farley Dr Unit 95
- 34 W Farley Dr Unit 97
- 20 W Farley Dr Unit 100
- 16 W Farley Dr Unit 101
- 34 E Pioneer Way Unit 72
- 93 W Farley Dr Unit 82
- 443 Highlands Dr
- 411 Highlands Dr
- 457 Highlands Dr
- 428 Highlands Dr
- 412 Highlands Dr
- 444 Highlands Dr
- 544 Highlands Dr
- 385 Highlands Dr
- 473 Highlands Dr
- 400 Highlands Dr
- 458 Highlands Dr
- 386 Highlands Dr
- 371 Highlands Dr
- 474 Highlands Dr
- 472 Highlands Dr
- 487 Highlands Dr
- 372 Highlands Dr
- Lot 146 Highlands Dr
- 148 Highlands Dr
- 0 Highlands Dr
Your Personal Tour Guide
Ask me questions while you tour the home.