Estimated Value: $507,000 - $564,000
1
Bed
1
Bath
1,019
Sq Ft
$523/Sq Ft
Est. Value
About This Home
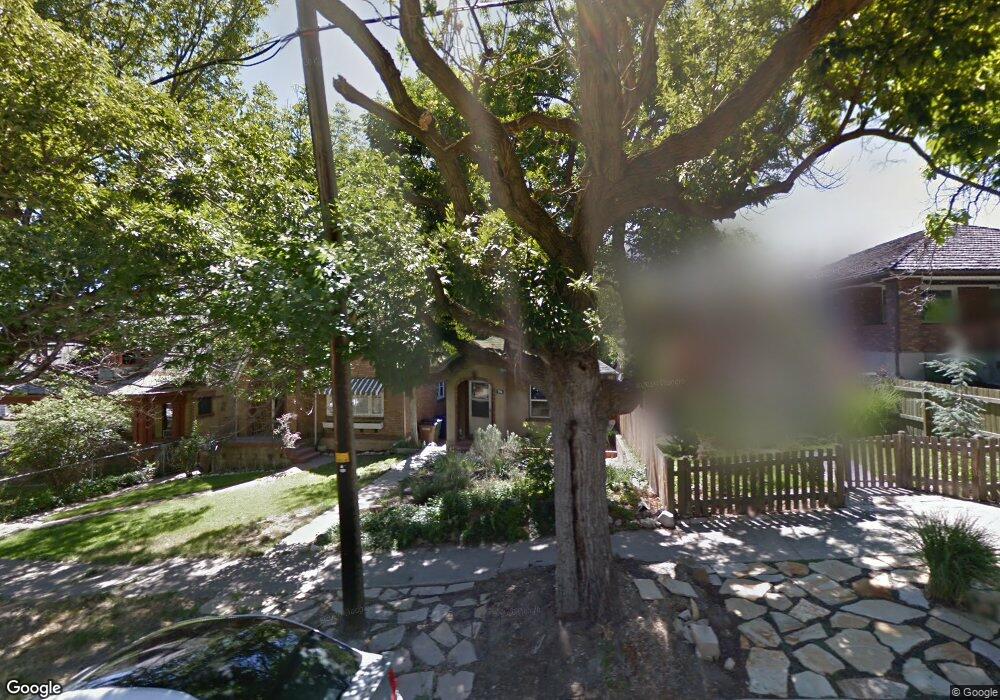
This home is located at 427 I St, Salt Lake City, UT 84103 and is currently estimated at $533,004, approximately $523 per square foot. 427 I St is a home located in Salt Lake County with nearby schools including Ensign School, West High, and Open Classroom.
Ownership History
Date
Name
Owned For
Owner Type
Purchase Details
Closed on
Mar 12, 2019
Sold by
Owens David R
Bought by
Owens David R and The David Robert Owens Living
Current Estimated Value
Purchase Details
Closed on
Jan 22, 2002
Sold by
Hill Bonnie K and Robyn Thompson C
Bought by
Owens Dave R
Home Financials for this Owner
Home Financials are based on the most recent Mortgage that was taken out on this home.
Original Mortgage
$114,187
Outstanding Balance
$46,894
Interest Rate
7.11%
Mortgage Type
FHA
Estimated Equity
$486,110
Create a Home Valuation Report for This Property
The Home Valuation Report is an in-depth analysis detailing your home's value as well as a comparison with similar homes in the area
Home Values in the Area
Average Home Value in this Area
Purchase History
| Date | Buyer | Sale Price | Title Company |
|---|---|---|---|
| Owens David R | -- | None Available | |
| Owens Dave R | -- | Superior Title |
Source: Public Records
Mortgage History
| Date | Status | Borrower | Loan Amount |
|---|---|---|---|
| Open | Owens Dave R | $114,187 |
Source: Public Records
Tax History Compared to Growth
Tax History
| Year | Tax Paid | Tax Assessment Tax Assessment Total Assessment is a certain percentage of the fair market value that is determined by local assessors to be the total taxable value of land and additions on the property. | Land | Improvement |
|---|---|---|---|---|
| 2025 | $45 | $486,400 | $223,300 | $263,100 |
| 2024 | $45 | $420,200 | $213,100 | $207,100 |
| 2023 | $267 | $397,800 | $204,900 | $192,900 |
| 2022 | $267 | $406,400 | $145,400 | $261,000 |
| 2021 | $26 | $327,500 | $118,000 | $209,500 |
| 2020 | $727 | $308,500 | $110,300 | $198,200 |
| 2019 | $1,334 | $186,700 | $103,200 | $83,500 |
| 2018 | $0 | $185,400 | $103,200 | $82,200 |
| 2017 | $1,366 | $174,300 | $103,200 | $71,100 |
| 2016 | $1,290 | $156,400 | $98,400 | $58,000 |
| 2015 | $1,238 | $142,200 | $90,900 | $51,300 |
| 2014 | $1,235 | $140,700 | $95,500 | $45,200 |
Source: Public Records
Map
Nearby Homes