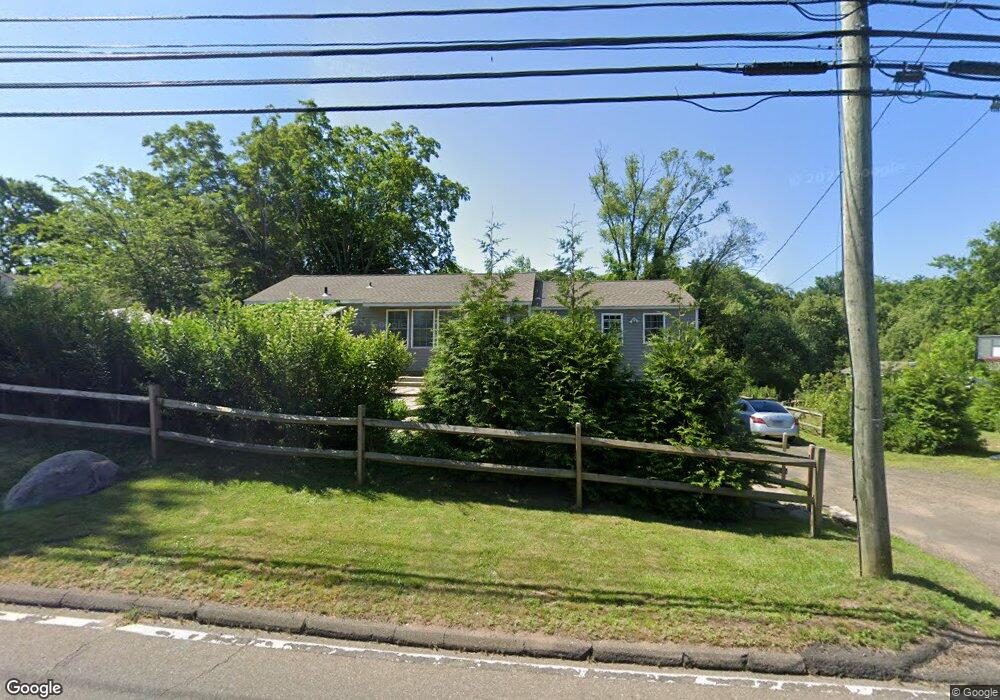
427 Leetes Island Rd Branford, CT 06405
Estimated Value: $453,000 - $576,000
3
Beds
3
Baths
1,405
Sq Ft
$360/Sq Ft
Est. Value
About This Home
This home is located at 427 Leetes Island Rd, Branford, CT 06405 and is currently estimated at $505,515, approximately $359 per square foot. 427 Leetes Island Rd is a home located in New Haven County with nearby schools including Francis Walsh Intermediate School and Branford High School.
Ownership History
Date
Name
Owned For
Owner Type
Purchase Details
Closed on
Oct 18, 2024
Sold by
Healy Richard J and Healy Kim J
Bought by
Healy Richard J
Current Estimated Value
Home Financials for this Owner
Home Financials are based on the most recent Mortgage that was taken out on this home.
Original Mortgage
$243,600
Outstanding Balance
$241,039
Interest Rate
6.35%
Mortgage Type
Stand Alone Refi Refinance Of Original Loan
Estimated Equity
$264,476
Purchase Details
Closed on
Mar 4, 2021
Sold by
Jm & Gd Llc
Bought by
Healy Richard A and Healy Kim J
Purchase Details
Closed on
Nov 24, 2020
Sold by
Jm & Gd Llc
Bought by
Mainetti John M and Dinicola Gary A
Purchase Details
Closed on
Jan 8, 2002
Sold by
Est Northam Leroy K and Enson Janet
Bought by
Jm & Gd Llc
Home Financials for this Owner
Home Financials are based on the most recent Mortgage that was taken out on this home.
Original Mortgage
$88,400
Interest Rate
6.72%
Create a Home Valuation Report for This Property
The Home Valuation Report is an in-depth analysis detailing your home's value as well as a comparison with similar homes in the area
Home Values in the Area
Average Home Value in this Area
Purchase History
| Date | Buyer | Sale Price | Title Company |
|---|---|---|---|
| Healy Richard J | -- | None Available | |
| Healy Richard J | -- | None Available | |
| Healy Richard A | $220,000 | None Available | |
| Healy Richard A | $220,000 | None Available | |
| Mainetti John M | -- | None Available | |
| Mainetti John M | -- | None Available | |
| Jm & Gd Llc | $230,000 | -- | |
| Jm & Gd Llc | $230,000 | -- |
Source: Public Records
Mortgage History
| Date | Status | Borrower | Loan Amount |
|---|---|---|---|
| Open | Healy Richard J | $243,600 | |
| Closed | Healy Richard J | $243,600 | |
| Previous Owner | Jm & Gd Llc | $140,000 | |
| Previous Owner | Jm & Gd Llc | $88,400 |
Source: Public Records
Tax History Compared to Growth
Tax History
| Year | Tax Paid | Tax Assessment Tax Assessment Total Assessment is a certain percentage of the fair market value that is determined by local assessors to be the total taxable value of land and additions on the property. | Land | Improvement |
|---|---|---|---|---|
| 2025 | $5,720 | $267,300 | $108,700 | $158,600 |
| 2024 | $5,563 | $182,500 | $100,000 | $82,500 |
| 2023 | $5,455 | $182,500 | $100,000 | $82,500 |
| 2022 | $5,375 | $182,500 | $100,000 | $82,500 |
| 2021 | $5,383 | $182,800 | $100,300 | $82,500 |
| 2020 | $5,287 | $182,800 | $100,300 | $82,500 |
| 2019 | $5,378 | $185,000 | $107,200 | $77,800 |
| 2018 | $5,318 | $185,700 | $107,200 | $78,500 |
| 2017 | $5,287 | $185,700 | $107,200 | $78,500 |
| 2016 | $5,090 | $185,700 | $107,200 | $78,500 |
| 2015 | $5,001 | $185,700 | $107,200 | $78,500 |
| 2014 | $5,043 | $192,200 | $107,200 | $85,000 |
Source: Public Records
Map
Nearby Homes
- 12 Bowhay Hill Rd
- 312 Leetes Island Rd
- 155 Stony Creek Rd
- 8 Gaylea Dr
- 0 Belden Island Unit 24090225
- 55-69 Sawmill Rd
- 33 Thimble Farms Rd
- 294 Thimble Island Rd
- 0 Rogers Island
- 0 Rogers Island Unit 122749
- 0 Beechwood Rd
- 29 Blackstone Ave
- 0 Potato Island Unit 24032744
- 10 Island View Ave
- 48 Meadow Wood Rd
- 15 Griffing Pond Rd
- 29 Crescent Bluff Ave
- 63 Gould Ln
- 0 Gould Ln
- 200 Damascus Rd
- 437 Leetes Island Rd
- 26 Thimble Island Rd
- 420 Leetes Island Rd
- 3 Howd Ave
- 12 Thimble Island Rd
- 5 Howd Ave
- 1 Howd Ave
- 7 Howd Ave
- 418 Leetes Island Rd
- 9 Howd Ave
- 18 Thimble Island Rd
- 18 Thimble Island Rd
- 7 Thimble Island Rd
- 436 Leetes Island Rd Unit 444
- 11 Howd Ave
- 57 Thimble Island Rd
- 5 Thimble Island Rd
- 22 Thimble Island Rd
- 449 Leetes Island Rd
- 408 Leetes Island Rd