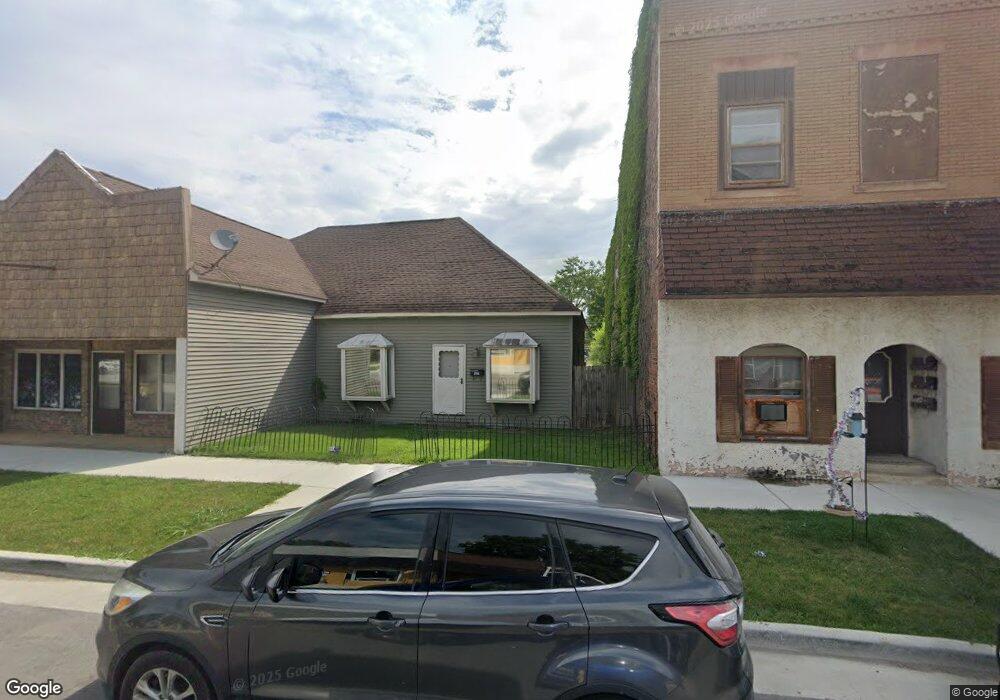
427 N 9th St Clinton, IN 47842
Estimated Value: $126,000 - $176,000
2
Beds
2
Baths
2,220
Sq Ft
$69/Sq Ft
Est. Value
About This Home
This home is located at 427 N 9th St, Clinton, IN 47842 and is currently estimated at $152,926, approximately $68 per square foot. 427 N 9th St is a home located in Vermillion County with nearby schools including South Vermillion High School and Sacred Heart School.
Ownership History
Date
Name
Owned For
Owner Type
Purchase Details
Closed on
Feb 7, 2022
Sold by
Alabaugh Ronald E
Bought by
Foxworthy Stephanie
Current Estimated Value
Home Financials for this Owner
Home Financials are based on the most recent Mortgage that was taken out on this home.
Original Mortgage
$79,900
Outstanding Balance
$68,115
Interest Rate
3.56%
Mortgage Type
Credit Line Revolving
Estimated Equity
$84,811
Purchase Details
Closed on
Jan 6, 2011
Sold by
Not Provided
Bought by
Alabaugh Ronald E
Purchase Details
Closed on
Jan 5, 2011
Sold by
Wyres William
Bought by
Alabaugh Ronald E
Purchase Details
Closed on
Nov 24, 2008
Sold by
Hein Justin C
Bought by
First Financial Bank
Create a Home Valuation Report for This Property
The Home Valuation Report is an in-depth analysis detailing your home's value as well as a comparison with similar homes in the area
Home Values in the Area
Average Home Value in this Area
Purchase History
| Date | Buyer | Sale Price | Title Company |
|---|---|---|---|
| Foxworthy Stephanie | $94,000 | Abstract & Title Of Parke Coun | |
| Foxworthy Eric | $94,000 | None Listed On Document | |
| Alabaugh Ronald E | $75,000 | -- | |
| Alabaugh Ronald E | $75,000 | Hendrich Title Company | |
| Alabaugh Ronald E | $75,000 | Hendrich Title Company | |
| First Financial Bank | -- | -- | |
| First Financial Bank | -- | Wilkinson Law Firm |
Source: Public Records
Mortgage History
| Date | Status | Borrower | Loan Amount |
|---|---|---|---|
| Open | Foxworthy Eric | $79,900 |
Source: Public Records
Tax History
| Year | Tax Paid | Tax Assessment Tax Assessment Total Assessment is a certain percentage of the fair market value that is determined by local assessors to be the total taxable value of land and additions on the property. | Land | Improvement |
|---|---|---|---|---|
| 2025 | $2,866 | $191,000 | $13,300 | $177,700 |
| 2024 | $2,866 | $143,300 | $13,300 | $130,000 |
| 2023 | $2,668 | $133,400 | $13,300 | $120,100 |
| 2022 | $1,626 | $133,200 | $13,300 | $119,900 |
| 2021 | $1,454 | $120,700 | $13,300 | $107,400 |
| 2020 | $1,176 | $100,000 | $16,400 | $83,600 |
| 2019 | $945 | $77,500 | $6,700 | $70,800 |
| 2018 | $935 | $80,900 | $6,700 | $74,200 |
| 2017 | $873 | $79,700 | $6,700 | $73,000 |
| 2016 | $840 | $77,400 | $6,700 | $70,700 |
| 2014 | $787 | $75,700 | $6,700 | $69,000 |
| 2013 | $787 | $75,900 | $6,700 | $69,200 |
Source: Public Records
Map
Nearby Homes
Your Personal Tour Guide
Ask me questions while you tour the home.