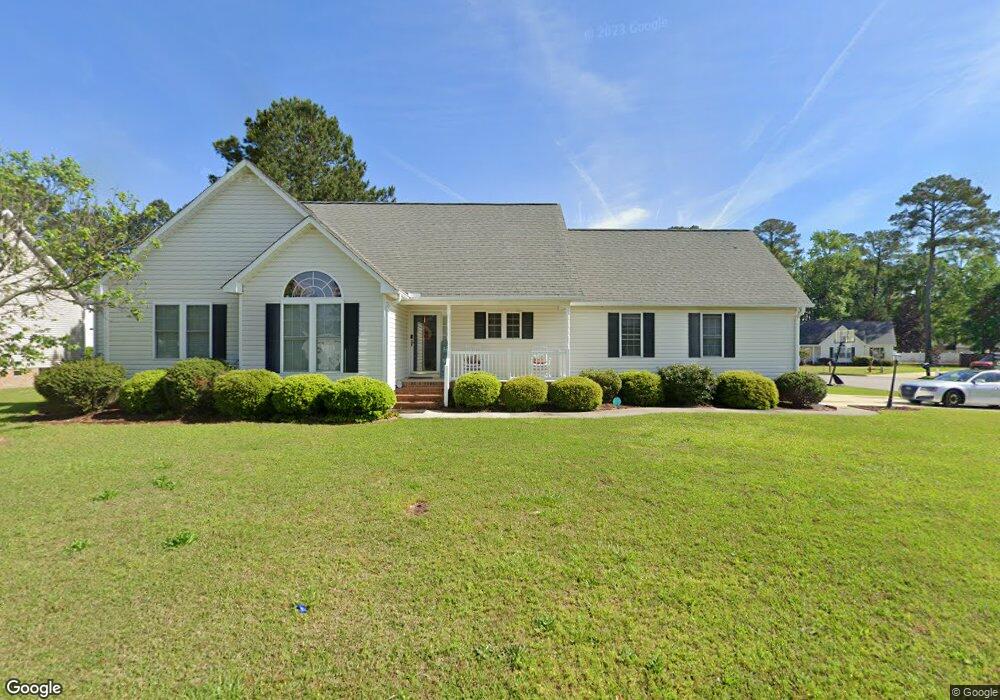
427 Primrose Ln Winterville, NC 28590
Estimated Value: $259,000 - $304,000
3
Beds
2
Baths
1,780
Sq Ft
$158/Sq Ft
Est. Value
About This Home
This home is located at 427 Primrose Ln, Winterville, NC 28590 and is currently estimated at $281,494, approximately $158 per square foot. 427 Primrose Ln is a home located in Pitt County with nearby schools including W.H. Robinson Elementary School, A.G. Cox Middle School, and South Central High School.
Ownership History
Date
Name
Owned For
Owner Type
Purchase Details
Closed on
Aug 8, 2019
Sold by
Trustee Svc Of Carolina
Bought by
Benninger Doris
Current Estimated Value
Purchase Details
Closed on
Jun 3, 2017
Sold by
Fulbright Christopher Bryan and Fulbright Jackie Lynn
Bought by
Woodhouse Lavall V
Home Financials for this Owner
Home Financials are based on the most recent Mortgage that was taken out on this home.
Original Mortgage
$158,000
Interest Rate
4.05%
Mortgage Type
VA
Purchase Details
Closed on
Dec 15, 2005
Sold by
Whitco Construction Inc
Bought by
Fulbright Christopher Bryan and Fulbright Jackie Lynn
Home Financials for this Owner
Home Financials are based on the most recent Mortgage that was taken out on this home.
Original Mortgage
$180,750
Interest Rate
6.23%
Mortgage Type
VA
Create a Home Valuation Report for This Property
The Home Valuation Report is an in-depth analysis detailing your home's value as well as a comparison with similar homes in the area
Home Values in the Area
Average Home Value in this Area
Purchase History
| Date | Buyer | Sale Price | Title Company |
|---|---|---|---|
| Benninger Doris | $137,102 | -- | |
| Woodhouse Lavall V | $158,000 | None Available | |
| Fulbright Christopher Bryan | $175,000 | None Available |
Source: Public Records
Mortgage History
| Date | Status | Borrower | Loan Amount |
|---|---|---|---|
| Previous Owner | Woodhouse Lavall V | $158,000 | |
| Previous Owner | Fulbright Christopher Bryan | $180,750 |
Source: Public Records
Tax History Compared to Growth
Tax History
| Year | Tax Paid | Tax Assessment Tax Assessment Total Assessment is a certain percentage of the fair market value that is determined by local assessors to be the total taxable value of land and additions on the property. | Land | Improvement |
|---|---|---|---|---|
| 2025 | $1,901 | $280,704 | $34,000 | $246,704 |
| 2024 | $1,889 | $280,704 | $34,000 | $246,704 |
| 2023 | $1,630 | $204,065 | $29,000 | $175,065 |
| 2022 | $1,637 | $204,065 | $29,000 | $175,065 |
| 2021 | $1,387 | $204,065 | $29,000 | $175,065 |
| 2020 | $1,640 | $204,065 | $29,000 | $175,065 |
| 2019 | $1,436 | $175,307 | $26,000 | $149,307 |
| 2018 | $1,372 | $175,307 | $26,000 | $149,307 |
| 2017 | $1,372 | $175,307 | $26,000 | $149,307 |
| 2016 | $1,354 | $175,307 | $26,000 | $149,307 |
| 2015 | $1,418 | $185,522 | $28,600 | $156,922 |
| 2014 | $1,418 | $185,522 | $28,600 | $156,922 |
Source: Public Records
Map
Nearby Homes
- 483 Primrose Ln
- 433 Drexel Ln
- 603 Brookfield Dr
- 613 Brookfield Dr
- 272 Primrose Ln
- 623 Norberry Dr
- 576 Norberry Dr
- 312 Brogden Ct
- 334 Gayle Blvd
- 2520 Ange St
- 2841 Verbena Way
- 263 Laurie Ellis Rd
- 2537 Jones St
- 2523 Jones St
- 2531 Jones St
- 626 Edenbrook Dr
- 2920 Jessica Dr Unit A
- 626 Winterfield Dr
- 227 Hammond St
- 561 Channel Dr
- 2710 Tonya Ct
- 419 Primrose Ln
- 2706 Tonya Ct
- 424 Primrose Ln
- 418 Primrose Ln
- 2703 Corey Ct
- 434 Primrose Ln
- 443 Primrose Ln
- 414 Primrose Ln
- 2705 Tonya Ct
- 440 Primrose Ln
- 2703 Tonya Ct
- 2700 Corey Ct
- 404 Primrose Ln
- 446 Primrose Ln
- 408 Lora Ln
- 451 Barrel Dr
- 405 Primrose Ln
- 443 Barrel Dr
- 2716 Ramblewood Ct