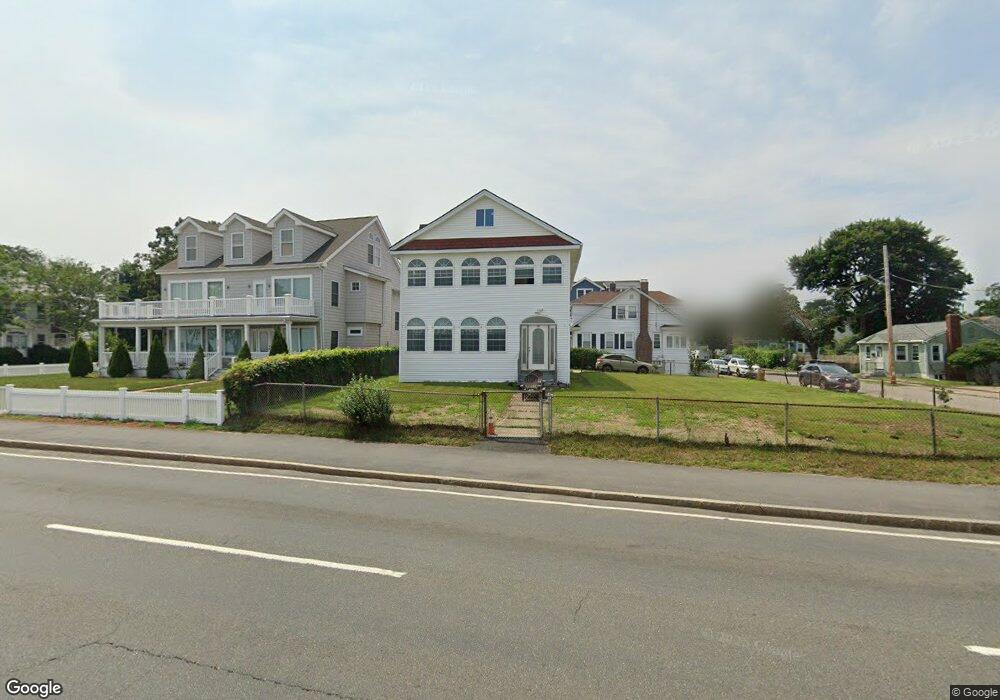
427 Quincy Shore Dr Quincy, MA 02171
Estimated Value: $961,000 - $1,184,000
4
Beds
2
Baths
2,308
Sq Ft
$475/Sq Ft
Est. Value
About This Home
This home is located at 427 Quincy Shore Dr, Quincy, MA 02171 and is currently estimated at $1,095,443, approximately $474 per square foot. 427 Quincy Shore Dr is a home located in Norfolk County with nearby schools including Squantum Elementary School, Atlantic Middle School, and North Quincy High School.
Ownership History
Date
Name
Owned For
Owner Type
Purchase Details
Closed on
Dec 16, 2015
Sold by
Barros Maria D
Bought by
Barros Maria D and Alves Dinis
Current Estimated Value
Purchase Details
Closed on
Jan 4, 2010
Sold by
Alves Dinis and Barros Marie D
Bought by
Barros Maria D
Home Financials for this Owner
Home Financials are based on the most recent Mortgage that was taken out on this home.
Original Mortgage
$424,297
Interest Rate
5.5%
Mortgage Type
FHA
Purchase Details
Closed on
Nov 24, 2008
Sold by
Bovill Christine
Bought by
Maria Alves Dinis and Maria Defatimabarros
Home Financials for this Owner
Home Financials are based on the most recent Mortgage that was taken out on this home.
Original Mortgage
$407,508
Interest Rate
6.03%
Mortgage Type
Purchase Money Mortgage
Purchase Details
Closed on
Nov 15, 2007
Sold by
Serafini Ft
Bought by
Bovill Christine
Create a Home Valuation Report for This Property
The Home Valuation Report is an in-depth analysis detailing your home's value as well as a comparison with similar homes in the area
Home Values in the Area
Average Home Value in this Area
Purchase History
| Date | Buyer | Sale Price | Title Company |
|---|---|---|---|
| Barros Maria D | -- | -- | |
| Barros Maria D | -- | -- | |
| Maria Alves Dinis | $445,000 | -- | |
| Bovill Christine | -- | -- | |
| Serafini Ft | -- | -- | |
| Serafini Ft | -- | -- | |
| Bovill Christine | -- | -- |
Source: Public Records
Mortgage History
| Date | Status | Borrower | Loan Amount |
|---|---|---|---|
| Previous Owner | Barros Maria D | $424,297 | |
| Previous Owner | Maria Alves Dinis | $407,508 |
Source: Public Records
Tax History Compared to Growth
Tax History
| Year | Tax Paid | Tax Assessment Tax Assessment Total Assessment is a certain percentage of the fair market value that is determined by local assessors to be the total taxable value of land and additions on the property. | Land | Improvement |
|---|---|---|---|---|
| 2025 | $11,309 | $980,800 | $437,300 | $543,500 |
| 2024 | $10,869 | $964,400 | $437,300 | $527,100 |
| 2023 | $10,356 | $930,500 | $397,500 | $533,000 |
| 2022 | $10,092 | $842,400 | $333,200 | $509,200 |
| 2021 | $10,268 | $845,800 | $333,200 | $512,600 |
| 2020 | $9,314 | $749,300 | $261,400 | $487,900 |
| 2019 | $9,076 | $723,200 | $262,700 | $460,500 |
| 2018 | $8,972 | $672,600 | $277,400 | $395,200 |
| 2017 | $8,875 | $626,300 | $252,200 | $374,100 |
| 2016 | $8,039 | $559,800 | $240,000 | $319,800 |
| 2015 | $7,585 | $519,500 | $216,200 | $303,300 |
| 2014 | $6,680 | $449,500 | $211,500 | $238,000 |
Source: Public Records
Map
Nearby Homes
- 18 Hummock Rd
- 25 Hummock Rd
- 201 Billings St
- 77 Botolph St
- 185 Quincy Shore Dr Unit A28
- 165 Quincy Shore Dr Unit C63
- 1 Edwin St Unit C
- 94 Newbury Ave Unit 100
- 148 Quincy Shore Dr Unit 30
- 237 Billings Rd
- 158 Quincy Shore Dr Unit 78
- 90 Shore Ave
- 90 Quincy Shore Dr Unit 501
- 90 Quincy Shore Dr Unit 701
- 935 E Squantum St
- 57 Quincy Shore Dr Unit 614
- 57 Quincy Shore Dr Unit PH South
- 176 W Elm Ave
- 133 Commander Shea Blvd Unit 219
- 133 Commander Shea Blvd Unit 506
- 429 Quincy Shore Dr Unit 2
- 429 Quincy Shore Dr Unit DRIVE
- 335 Atlantic St
- 433 Quincy Shore Dr
- 331 Atlantic St Unit 2
- 331 Atlantic St
- 331 Atlantic St Unit 1
- 331 Atlantic St Unit 3
- 419 Quincy Shore Dr
- 64 Hovey St
- 336 Atlantic St
- 327 Atlantic St
- 329 Atlantic St Unit 1
- 60 Hovey St
- 443 Quincy Shore Dr
- 443 Quincy Shore Dr Unit 3
- 328 Atlantic St
- 415 Quincy Shore Dr
- 415 Quincy Shore Dr Unit 2
- 87 Conant Rd Unit 2