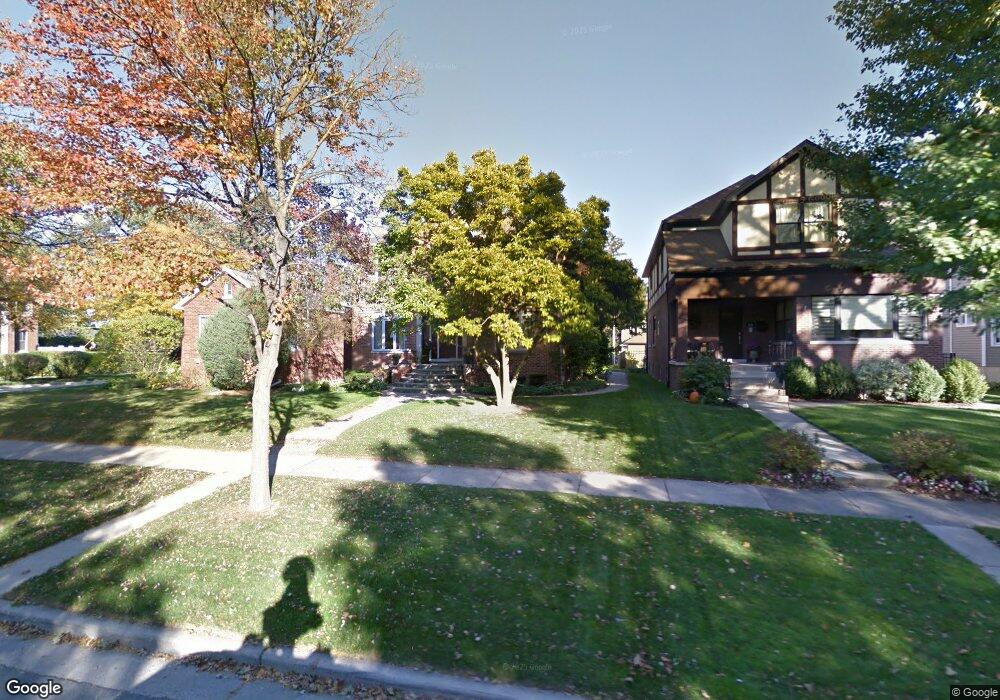
427 S Fairview Ave Park Ridge, IL 60068
Estimated Value: $1,139,352 - $1,269,000
4
Beds
3
Baths
3,232
Sq Ft
$367/Sq Ft
Est. Value
About This Home
This home is located at 427 S Fairview Ave, Park Ridge, IL 60068 and is currently estimated at $1,184,838, approximately $366 per square foot. 427 S Fairview Ave is a home located in Cook County with nearby schools including Theodore Roosevelt Elementary School, Lincoln Middle School, and Maine South High School.
Ownership History
Date
Name
Owned For
Owner Type
Purchase Details
Closed on
Oct 9, 2003
Sold by
Odonnell Patrick J and Odonnell Eileen B
Bought by
Zivkovic Mark N and Zivkovic Jean M
Current Estimated Value
Home Financials for this Owner
Home Financials are based on the most recent Mortgage that was taken out on this home.
Original Mortgage
$322,700
Outstanding Balance
$150,798
Interest Rate
6.23%
Mortgage Type
Unknown
Estimated Equity
$1,034,040
Purchase Details
Closed on
Oct 19, 2000
Sold by
Parkway Bank & Trust Company
Bought by
Odonnell Patrick J and Odonnell Eileen B
Purchase Details
Closed on
Mar 22, 1994
Sold by
Wind Michael P and Wind Nancy K
Bought by
Parkway Bank & Trust Company
Home Financials for this Owner
Home Financials are based on the most recent Mortgage that was taken out on this home.
Original Mortgage
$130,000
Interest Rate
7.27%
Create a Home Valuation Report for This Property
The Home Valuation Report is an in-depth analysis detailing your home's value as well as a comparison with similar homes in the area
Home Values in the Area
Average Home Value in this Area
Purchase History
| Date | Buyer | Sale Price | Title Company |
|---|---|---|---|
| Zivkovic Mark N | $778,000 | Rtc | |
| Odonnell Patrick J | -- | -- | |
| Parkway Bank & Trust Company | $132,000 | -- |
Source: Public Records
Mortgage History
| Date | Status | Borrower | Loan Amount |
|---|---|---|---|
| Open | Zivkovic Mark N | $322,700 | |
| Previous Owner | Parkway Bank & Trust Company | $130,000 | |
| Closed | Zivkovic Mark N | $100,000 |
Source: Public Records
Tax History Compared to Growth
Tax History
| Year | Tax Paid | Tax Assessment Tax Assessment Total Assessment is a certain percentage of the fair market value that is determined by local assessors to be the total taxable value of land and additions on the property. | Land | Improvement |
|---|---|---|---|---|
| 2024 | $20,814 | $73,636 | $14,620 | $59,016 |
| 2023 | $19,916 | $80,003 | $14,620 | $65,383 |
| 2022 | $19,916 | $80,003 | $14,620 | $65,383 |
| 2021 | $20,146 | $69,569 | $9,030 | $60,539 |
| 2020 | $19,413 | $69,569 | $9,030 | $60,539 |
| 2019 | $19,032 | $76,450 | $9,030 | $67,420 |
| 2018 | $17,612 | $64,979 | $7,740 | $57,239 |
| 2017 | $17,554 | $64,979 | $7,740 | $57,239 |
| 2016 | $17,144 | $64,979 | $7,740 | $57,239 |
| 2015 | $16,860 | $57,289 | $6,450 | $50,839 |
| 2014 | $19,591 | $67,364 | $6,450 | $60,914 |
| 2013 | $18,539 | $67,364 | $6,450 | $60,914 |
Source: Public Records
Map
Nearby Homes
- 316 S Fairview Ave
- 301 S Prospect Ave
- 623 S Prospect Ave
- 428 S Clifton Ave
- 249 S Vine Ave Unit B
- 718 S Washington Ave
- 819 Albion Ave
- 820 W Talcott Rd
- 103 N Clifton Ave
- 919 S Chester Ave
- 170 N Northwest Hwy Unit 410
- 170 N Northwest Hwy Unit 407
- 1016 Arthur St
- 425 W Talcott Rd
- 1015 Arthur St
- 1301 W Touhy Ave Unit 315
- 1014 S Chester Ave
- 320 Grant Place
- 400 S Northwest Hwy Unit 312B
- 1116 S Cumberland Ave
- 431 S Fairview Ave
- 421 S Fairview Ave
- 433 S Fairview Ave
- 501 S Fairview Ave
- 413 S Fairview Ave
- 424 S Prospect Ave
- 505 S Fairview Ave
- 420 S Prospect Ave
- 500 S Prospect Ave
- 428 S Prospect Ave
- 424 S Fairview Ave
- 420 S Fairview Ave
- 428 S Fairview Ave
- 509 S Fairview Ave
- 412 S Prospect Ave
- 502 S Prospect Ave
- 432 S Fairview Ave
- 405 S Fairview Ave
- 515 S Fairview Ave