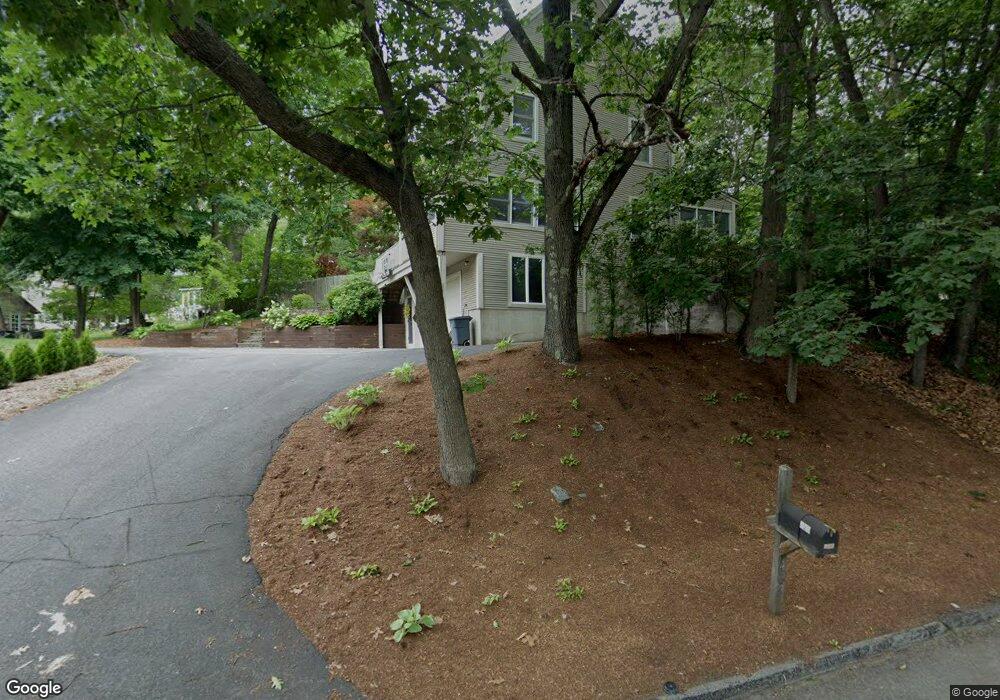
427 S Quinsigamond Ave Unit 433 Shrewsbury, MA 01545
Estimated Value: $730,000 - $809,000
3
Beds
4
Baths
2,132
Sq Ft
$359/Sq Ft
Est. Value
About This Home
This home is located at 427 S Quinsigamond Ave Unit 433, Shrewsbury, MA 01545 and is currently estimated at $766,263, approximately $359 per square foot. 427 S Quinsigamond Ave Unit 433 is a home located in Worcester County with nearby schools including Calvin Coolidge Elementary School, Sherwood Middle School, and Oak Middle School.
Ownership History
Date
Name
Owned For
Owner Type
Purchase Details
Closed on
Jul 16, 2013
Sold by
Macdonald Jason
Bought by
Macdonald Christine
Current Estimated Value
Purchase Details
Closed on
Oct 25, 2001
Sold by
Campanella Kevin M and Campanella Karen P
Bought by
Macdonald Jason and Macdonald Christine
Purchase Details
Closed on
Aug 14, 1998
Sold by
Stratton Michael W and Stratton Elaine B
Bought by
Campanella Kevin M and Campanella Karen P
Purchase Details
Closed on
Jan 24, 1996
Sold by
Hutker Timothy and Hutker Brenda
Bought by
Stratton Michael and Stratton Elaine
Create a Home Valuation Report for This Property
The Home Valuation Report is an in-depth analysis detailing your home's value as well as a comparison with similar homes in the area
Home Values in the Area
Average Home Value in this Area
Purchase History
| Date | Buyer | Sale Price | Title Company |
|---|---|---|---|
| Macdonald Christine | -- | -- | |
| Macdonald Christine | -- | -- | |
| Macdonald Jason | $310,000 | -- | |
| Macdonald Jason | $310,000 | -- | |
| Campanella Kevin M | $180,000 | -- | |
| Campanella Kevin M | $180,000 | -- | |
| Stratton Michael | $155,000 | -- | |
| Stratton Michael | $155,000 | -- |
Source: Public Records
Mortgage History
| Date | Status | Borrower | Loan Amount |
|---|---|---|---|
| Previous Owner | Stratton Michael | $279,000 | |
| Previous Owner | Stratton Michael | $62,000 |
Source: Public Records
Tax History Compared to Growth
Tax History
| Year | Tax Paid | Tax Assessment Tax Assessment Total Assessment is a certain percentage of the fair market value that is determined by local assessors to be the total taxable value of land and additions on the property. | Land | Improvement |
|---|---|---|---|---|
| 2025 | $79 | $659,600 | $234,800 | $424,800 |
| 2024 | $7,822 | $631,800 | $223,600 | $408,200 |
| 2023 | $7,320 | $557,900 | $223,600 | $334,300 |
| 2022 | $6,481 | $459,300 | $182,800 | $276,500 |
| 2021 | $5,644 | $427,900 | $171,100 | $256,800 |
| 2020 | $5,327 | $427,200 | $171,100 | $256,100 |
| 2019 | $5,180 | $412,100 | $167,100 | $245,000 |
| 2018 | $5,206 | $411,200 | $160,500 | $250,700 |
| 2017 | $4,951 | $385,900 | $145,400 | $240,500 |
| 2016 | $4,243 | $326,400 | $128,800 | $197,600 |
| 2015 | $4,093 | $310,100 | $116,900 | $193,200 |
Source: Public Records
Map
Nearby Homes
- 94 Grove St
- 76 Grove St
- 151 Hartford Turnpike Unit 13
- 45 -45A Kinglet Dr
- 62 Edgemere Blvd
- 15 Lakeside Dr
- 23 Canna Dr
- 259 S Quinsigamond Ave
- 629 Grafton St
- 1 Canton Ct Unit 35
- 1 Purinton St
- 190 S Quinsigamond Ave Unit 102
- 36 Westborough St
- 589 Sunderland Rd
- 48 Pointe Rok Dr Unit 48G
- 76 Hillside Dr
- 38 Etre Dr
- 34 Clews St
- 468 Grafton St
- 7 Atlas St
- 425 S Quinsigamond Ave
- 429 S Quinsigamond Ave Unit B
- 429 S Quinsigamond Ave Unit A
- 429 S Quinsigamond Ave Unit 429B
- 429A S Quinsigamond Ave Unit 429A
- 429A S Quinsigamond Ave Unit A
- 429A S Quinsigamond Ave
- 9 Overlook Ave
- 8 Highland St
- 5 Highland St
- 426 S Quinsigamond Ave
- 426 S Quinsigamond Ave Unit 1
- 7 Highland St
- 15 Overlook Ave
- 417 S Quinsigamond Ave Unit 419
- 21 Overlook Ave
- 12 Overlook Ave
- 490 Lake St
- 16 Overlook Ave
- 422 S Quinsigamond Ave