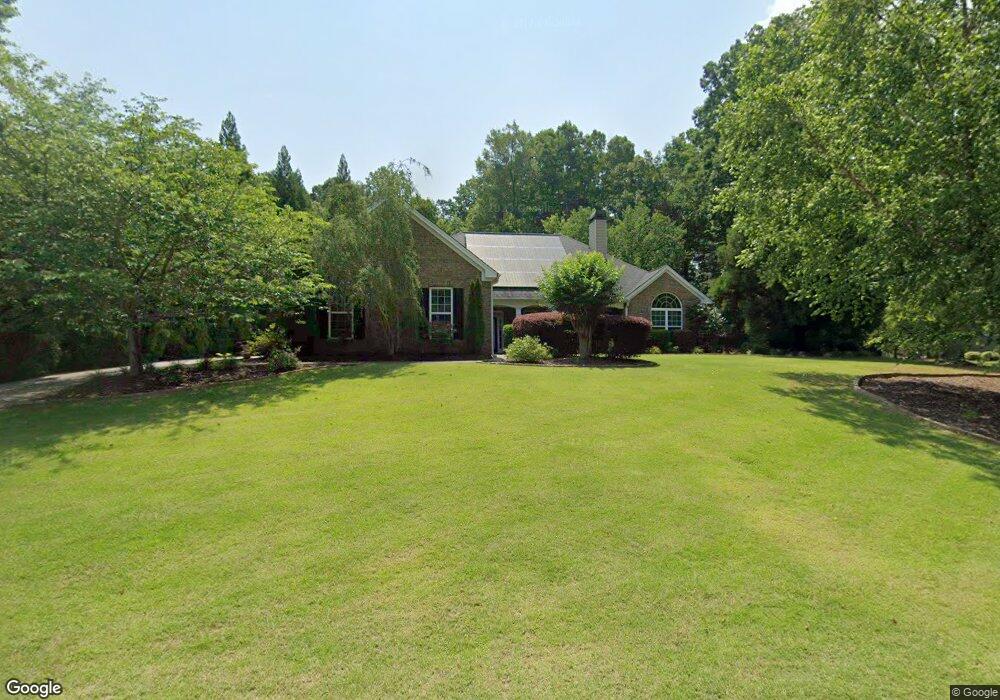
427 Southampton Cir Hoschton, GA 30548
Estimated Value: $448,138 - $629,000
--
Bed
3
Baths
2,638
Sq Ft
$206/Sq Ft
Est. Value
About This Home
This home is located at 427 Southampton Cir, Hoschton, GA 30548 and is currently estimated at $543,285, approximately $205 per square foot. 427 Southampton Cir is a home located in Jackson County with nearby schools including Gum Springs Elementary School, West Jackson Middle School, and Jackson County High School.
Ownership History
Date
Name
Owned For
Owner Type
Purchase Details
Closed on
Jan 11, 2022
Sold by
Warren James C
Bought by
Warren James C and Warren Shari Kleckner
Current Estimated Value
Home Financials for this Owner
Home Financials are based on the most recent Mortgage that was taken out on this home.
Original Mortgage
$265,571
Outstanding Balance
$245,107
Interest Rate
3.22%
Mortgage Type
VA
Estimated Equity
$298,178
Purchase Details
Closed on
Feb 20, 2020
Sold by
Warren James C
Bought by
Warren Shari Klechner
Purchase Details
Closed on
Feb 21, 2006
Sold by
Not Provided
Bought by
Warren Shari and Warren Jim
Home Financials for this Owner
Home Financials are based on the most recent Mortgage that was taken out on this home.
Original Mortgage
$250,550
Interest Rate
6.05%
Mortgage Type
New Conventional
Purchase Details
Closed on
Aug 12, 2004
Sold by
Liberty Crest Properties Inc
Bought by
James Butler Homes Inc
Create a Home Valuation Report for This Property
The Home Valuation Report is an in-depth analysis detailing your home's value as well as a comparison with similar homes in the area
Home Values in the Area
Average Home Value in this Area
Purchase History
| Date | Buyer | Sale Price | Title Company |
|---|---|---|---|
| Warren James C | -- | -- | |
| Warren James C | -- | -- | |
| Warren Shari Klechner | -- | -- | |
| Warren Shari | $278,420 | -- | |
| James Butler Homes Inc | $180,000 | -- |
Source: Public Records
Mortgage History
| Date | Status | Borrower | Loan Amount |
|---|---|---|---|
| Open | Warren James C | $265,571 | |
| Previous Owner | Warren Shari | $250,550 |
Source: Public Records
Tax History Compared to Growth
Tax History
| Year | Tax Paid | Tax Assessment Tax Assessment Total Assessment is a certain percentage of the fair market value that is determined by local assessors to be the total taxable value of land and additions on the property. | Land | Improvement |
|---|---|---|---|---|
| 2024 | $4,140 | $155,400 | $20,480 | $134,920 |
| 2023 | $4,140 | $141,120 | $20,480 | $120,640 |
| 2022 | $3,572 | $118,160 | $20,480 | $97,680 |
| 2021 | $3,595 | $118,160 | $20,480 | $97,680 |
| 2020 | $3,340 | $101,040 | $20,480 | $80,560 |
| 2019 | $3,388 | $101,040 | $20,480 | $80,560 |
| 2018 | $3,297 | $97,120 | $20,480 | $76,640 |
| 2017 | $3,066 | $89,749 | $20,480 | $69,269 |
| 2016 | $3,079 | $89,749 | $20,480 | $69,269 |
| 2015 | $2,724 | $79,269 | $10,000 | $69,269 |
| 2014 | $2,616 | $77,740 | $10,000 | $67,740 |
| 2013 | -- | $77,740 | $10,000 | $67,740 |
Source: Public Records
Map
Nearby Homes
- 391 Southampton Cir
- 455 S Hampton Cir
- 455 Southampton Cir
- 432 Southampton Cir
- 462 Southampton Cir
- 195 Montvale Dr
- 499 Southampton Cir
- 167 Montvale Dr
- 139 Montvale Dr
- 139 Montvale Dr Unit 80
- 117 Montvale Dr
- 360 Southampton Cir
- 317 Southampton Cir
- 486 Southampton Cir
- 510 Southampton Cir
- 289 Southampton Cir
- 219 Montvale Dr
- 336 Southampton Cir
- 81 Montvale Dr
- 547 Southampton Cir