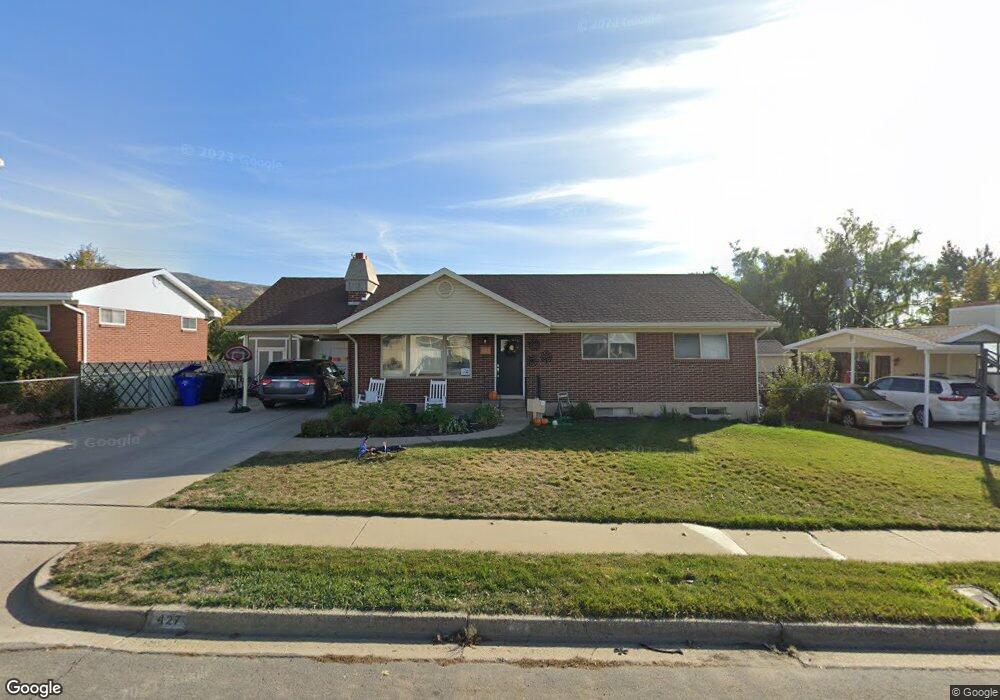
427 W 2400 S Bountiful, UT 84010
Estimated Value: $509,000 - $567,000
5
Beds
3
Baths
2,200
Sq Ft
$241/Sq Ft
Est. Value
About This Home
This home is located at 427 W 2400 S, Bountiful, UT 84010 and is currently estimated at $531,184, approximately $241 per square foot. 427 W 2400 S is a home located in Davis County with nearby schools including Boulton School, South Davis Junior High School, and Woods Cross High School.
Ownership History
Date
Name
Owned For
Owner Type
Purchase Details
Closed on
Mar 19, 2020
Sold by
King Daniel
Bought by
King Daniel and King Jennifer
Current Estimated Value
Home Financials for this Owner
Home Financials are based on the most recent Mortgage that was taken out on this home.
Original Mortgage
$173,000
Outstanding Balance
$152,924
Interest Rate
3.4%
Mortgage Type
New Conventional
Estimated Equity
$378,260
Purchase Details
Closed on
Jun 26, 2013
Sold by
Sowers Debbie
Bought by
King Daniel
Home Financials for this Owner
Home Financials are based on the most recent Mortgage that was taken out on this home.
Original Mortgage
$193,235
Interest Rate
3.75%
Mortgage Type
FHA
Purchase Details
Closed on
May 9, 2013
Sold by
Sowets Debbie
Bought by
Sowers Debbie and Marell And Luana Johnson Family Trust
Home Financials for this Owner
Home Financials are based on the most recent Mortgage that was taken out on this home.
Original Mortgage
$193,235
Interest Rate
3.75%
Mortgage Type
FHA
Create a Home Valuation Report for This Property
The Home Valuation Report is an in-depth analysis detailing your home's value as well as a comparison with similar homes in the area
Home Values in the Area
Average Home Value in this Area
Purchase History
| Date | Buyer | Sale Price | Title Company |
|---|---|---|---|
| King Daniel | -- | First American Title | |
| King Daniel | -- | Title West Title Co | |
| Sowers Debbie | -- | None Available |
Source: Public Records
Mortgage History
| Date | Status | Borrower | Loan Amount |
|---|---|---|---|
| Open | King Daniel | $173,000 | |
| Closed | King Daniel | $193,235 |
Source: Public Records
Tax History Compared to Growth
Tax History
| Year | Tax Paid | Tax Assessment Tax Assessment Total Assessment is a certain percentage of the fair market value that is determined by local assessors to be the total taxable value of land and additions on the property. | Land | Improvement |
|---|---|---|---|---|
| 2025 | $2,847 | $254,650 | $130,105 | $124,545 |
| 2024 | $2,643 | $245,300 | $115,606 | $129,694 |
| 2023 | $2,542 | $428,000 | $213,328 | $214,672 |
| 2022 | $2,444 | $224,951 | $116,661 | $108,290 |
| 2021 | $2,253 | $317,000 | $152,650 | $164,350 |
| 2020 | $1,998 | $281,000 | $130,519 | $150,481 |
| 2019 | $2,029 | $279,000 | $138,666 | $140,334 |
| 2018 | $1,889 | $255,000 | $135,944 | $119,056 |
| 2016 | $1,600 | $116,490 | $56,153 | $60,337 |
| 2015 | $1,530 | $104,885 | $56,153 | $48,732 |
| 2014 | $1,713 | $122,160 | $56,153 | $66,007 |
| 2013 | -- | $105,595 | $43,945 | $61,650 |
Source: Public Records
Map
Nearby Homes
- 2095 S Main St Unit 17
- 2095 S Main St Unit 23
- 2943 S 400 W
- 1950 S 200 W Unit 32
- 117 W 3000 S
- 1820 S 440 W
- 553 W 1880 S
- 527 Applewood Dr
- 3183 S 500 W
- 2008 S 700 W
- 3238 S 675 W
- 1602 S 550 W
- 2281 S 250 E
- 269 E 2200 S
- 260 E 1100 N
- 260 E 1100 N Unit A14
- 320 E 2100 S
- 296 E 2050 S Unit 2
- 770 W 1900 S
- 757 W 3200 S