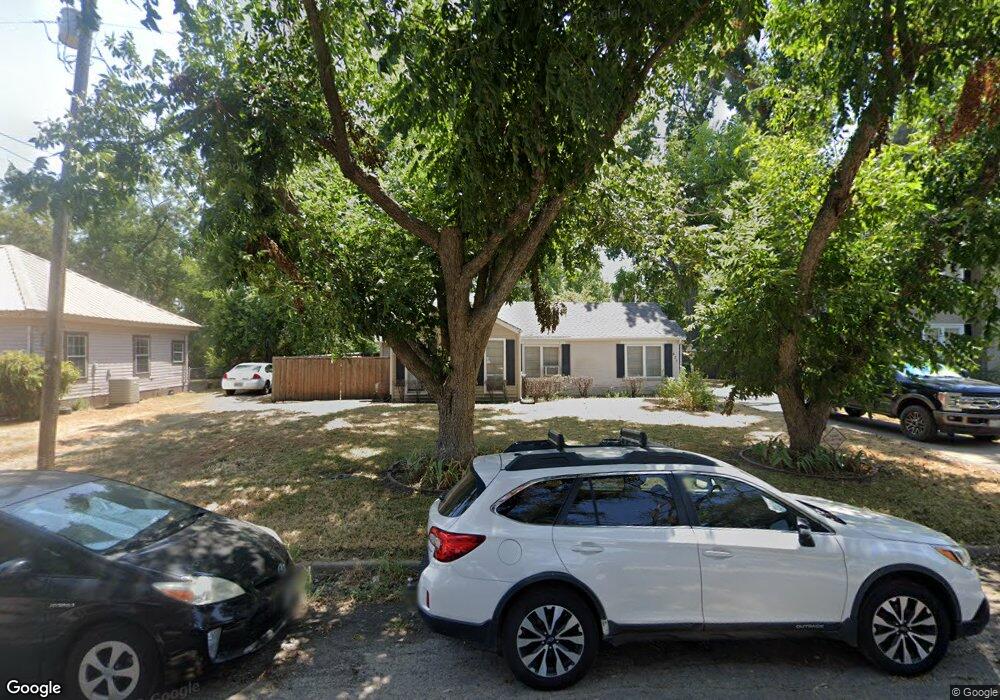
427 W James St Wills Point, TX 75169
Estimated Value: $156,000 - $225,000
--
Bed
--
Bath
1,928
Sq Ft
$99/Sq Ft
Est. Value
About This Home
This home is located at 427 W James St, Wills Point, TX 75169 and is currently estimated at $191,073, approximately $99 per square foot. 427 W James St is a home located in Van Zandt County with nearby schools including Wills Point Middle School, Earnest O. Woods Intermediate School, and Wills Point Junior High School.
Ownership History
Date
Name
Owned For
Owner Type
Purchase Details
Closed on
Jan 17, 2008
Sold by
Deutsche Bank National Trust Company
Bought by
Lowery Justin Earl
Current Estimated Value
Home Financials for this Owner
Home Financials are based on the most recent Mortgage that was taken out on this home.
Original Mortgage
$31,000
Outstanding Balance
$19,558
Interest Rate
6.15%
Mortgage Type
Purchase Money Mortgage
Estimated Equity
$171,515
Purchase Details
Closed on
Mar 5, 2007
Sold by
Adams Susan and Adams James
Bought by
Lowery Justin E
Purchase Details
Closed on
Sep 9, 2005
Sold by
Holloway Hope L
Bought by
Adams Susan and Adams James
Home Financials for this Owner
Home Financials are based on the most recent Mortgage that was taken out on this home.
Original Mortgage
$77,600
Interest Rate
8.37%
Mortgage Type
New Conventional
Purchase Details
Closed on
Oct 14, 1986
Bought by
Lowery Justin E
Purchase Details
Closed on
Oct 15, 1976
Bought by
Lowery Justin E
Create a Home Valuation Report for This Property
The Home Valuation Report is an in-depth analysis detailing your home's value as well as a comparison with similar homes in the area
Home Values in the Area
Average Home Value in this Area
Purchase History
| Date | Buyer | Sale Price | Title Company |
|---|---|---|---|
| Lowery Justin Earl | -- | None Available | |
| Lowery Justin E | -- | -- | |
| Adams Susan | -- | None Available | |
| Lowery Justin E | -- | -- | |
| Lowery Justin E | -- | -- |
Source: Public Records
Mortgage History
| Date | Status | Borrower | Loan Amount |
|---|---|---|---|
| Open | Lowery Justin Earl | $31,000 | |
| Previous Owner | Adams Susan | $77,600 |
Source: Public Records
Tax History Compared to Growth
Tax History
| Year | Tax Paid | Tax Assessment Tax Assessment Total Assessment is a certain percentage of the fair market value that is determined by local assessors to be the total taxable value of land and additions on the property. | Land | Improvement |
|---|---|---|---|---|
| 2024 | $1,124 | $103,310 | $12,800 | $90,510 |
| 2023 | $935 | $96,320 | $13,750 | $82,570 |
| 2022 | $1,766 | $73,460 | $7,330 | $66,130 |
| 2021 | $1,517 | $60,860 | $7,210 | $53,650 |
| 2020 | $1,548 | $59,080 | $7,210 | $51,870 |
| 2019 | $1,301 | $48,670 | $7,210 | $41,460 |
| 2018 | $1,140 | $43,970 | $7,210 | $36,760 |
| 2017 | $1,237 | $51,180 | $7,370 | $43,810 |
| 2016 | $1,124 | $46,500 | $7,210 | $39,290 |
| 2015 | $1,187 | $47,140 | $7,210 | $39,930 |
| 2014 | $1,161 | $49,820 | $7,210 | $42,610 |
Source: Public Records
Map
Nearby Homes
- 100 Juanita Ave
- N/A Tbd Pecan Oak Trail
- 2667 Vz County Road 3820
- 103 Juanita Ave
- 303 N 3rd St
- 124 Juanita Ave
- Lot 19 Farm To Market 47
- 411 N 3rd St
- 233 E High St
- 129 Juanita Ave
- 225 E Oneal St
- 541 Pecan Ave
- 231 S 2nd St
- 6048 Vz County Rd Unit 2120
- 4141 Farm To Market Road 751
- 555 E James St
- 821 Gibbard Ave
- 514 Canton Ave
- 601 E North St
- 618 Burnett St
- 439 W James St
- 415 W James St
- 426 W North Commerce St
- 125 N Wills St
- 403 W James St
- 440 W North Commerce St
- 416 W James St
- 428 W James St
- 428 428 W James St
- 440 W James St
- 410 W James St
- 503 W James St
- 205 N Mary St
- 517 W James St
- 126 N Wills St
- 217 N Wills St
- 206 N Wills St
- 221 N Wills St
- 520 W North Commerce St
- 0000 0