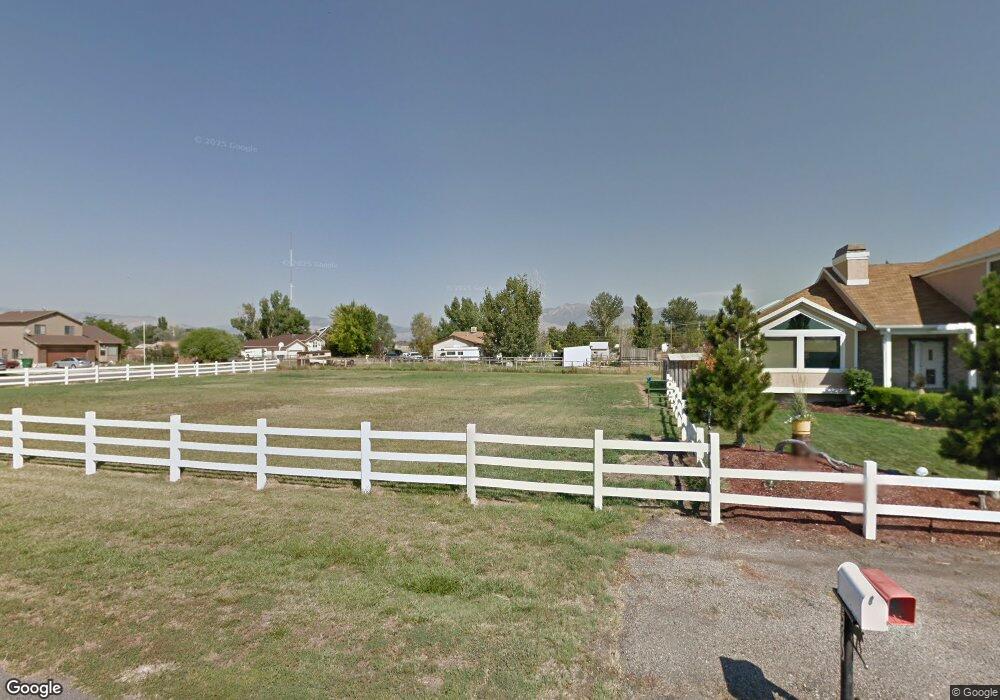
4270 S 4375 W West Haven, UT 84401
Estimated Value: $563,000 - $633,000
3
Beds
3
Baths
2,301
Sq Ft
$262/Sq Ft
Est. Value
About This Home
This home is located at 4270 S 4375 W, West Haven, UT 84401 and is currently estimated at $602,792, approximately $261 per square foot. 4270 S 4375 W is a home located in Weber County with nearby schools including Country View School, Rocky Mountain Junior High School, and Fremont High School.
Ownership History
Date
Name
Owned For
Owner Type
Purchase Details
Closed on
Oct 7, 2022
Sold by
Shafer David Cole
Bought by
Perez Jesus and Perez Efrain
Current Estimated Value
Home Financials for this Owner
Home Financials are based on the most recent Mortgage that was taken out on this home.
Original Mortgage
$475,000
Outstanding Balance
$455,481
Interest Rate
5.55%
Mortgage Type
New Conventional
Estimated Equity
$147,311
Purchase Details
Closed on
Nov 21, 2012
Sold by
Moulding Randy
Bought by
Shafer David
Home Financials for this Owner
Home Financials are based on the most recent Mortgage that was taken out on this home.
Original Mortgage
$156,000
Interest Rate
3.35%
Mortgage Type
New Conventional
Purchase Details
Closed on
Jan 6, 1998
Sold by
Bates Eleanor G and Hokanson Lynn B
Bought by
Moulding Randy
Create a Home Valuation Report for This Property
The Home Valuation Report is an in-depth analysis detailing your home's value as well as a comparison with similar homes in the area
Home Values in the Area
Average Home Value in this Area
Purchase History
| Date | Buyer | Sale Price | Title Company |
|---|---|---|---|
| Perez Jesus | -- | Old Republic Title | |
| Shafer David | -- | Mountain View Title | |
| Moulding Randy | -- | -- |
Source: Public Records
Mortgage History
| Date | Status | Borrower | Loan Amount |
|---|---|---|---|
| Open | Perez Jesus | $475,000 | |
| Previous Owner | Shafer David | $156,000 |
Source: Public Records
Tax History Compared to Growth
Tax History
| Year | Tax Paid | Tax Assessment Tax Assessment Total Assessment is a certain percentage of the fair market value that is determined by local assessors to be the total taxable value of land and additions on the property. | Land | Improvement |
|---|---|---|---|---|
| 2025 | $3,674 | $522,349 | $180,009 | $342,340 |
| 2024 | $3,485 | $282,774 | $99,004 | $183,770 |
| 2023 | $3,286 | $268,470 | $99,005 | $169,465 |
| 2022 | $3,362 | $284,350 | $99,005 | $185,345 |
| 2021 | $2,943 | $411,000 | $94,243 | $316,757 |
| 2020 | $2,905 | $384,000 | $79,915 | $304,085 |
| 2019 | $2,741 | $348,000 | $79,899 | $268,101 |
| 2018 | $2,592 | $320,000 | $66,078 | $253,922 |
| 2017 | $2,302 | $273,000 | $65,929 | $207,071 |
| 2016 | $2,026 | $130,460 | $29,586 | $100,874 |
| 2015 | $1,965 | $125,656 | $29,586 | $96,070 |
| 2014 | $1,811 | $113,858 | $29,586 | $84,272 |
Source: Public Records
Map
Nearby Homes
- 4521 W 3950 S Unit 5
- 4712 W 4100 S
- 4080 W 4000 S
- 3880 S 4550 W
- 3984 W 4000 S
- 4756 S 4300 W
- 4094 W 4700 S
- 3795 S 4250 W Unit D
- 4097 W 4750 S
- 3941 S 3850 W
- 4643 S 3900 W
- 4258 W 3775 S
- 4614 W 3725 S Unit 235
- 4618 W 3725 S Unit 233
- 4622 W 3725 S Unit 231
- 4106 W 4875 S
- 3690 S 4625 W Unit 228
- 4141 W 4875 S
- 3678 S 4625 W Unit 225
- 4357 S 3700 W