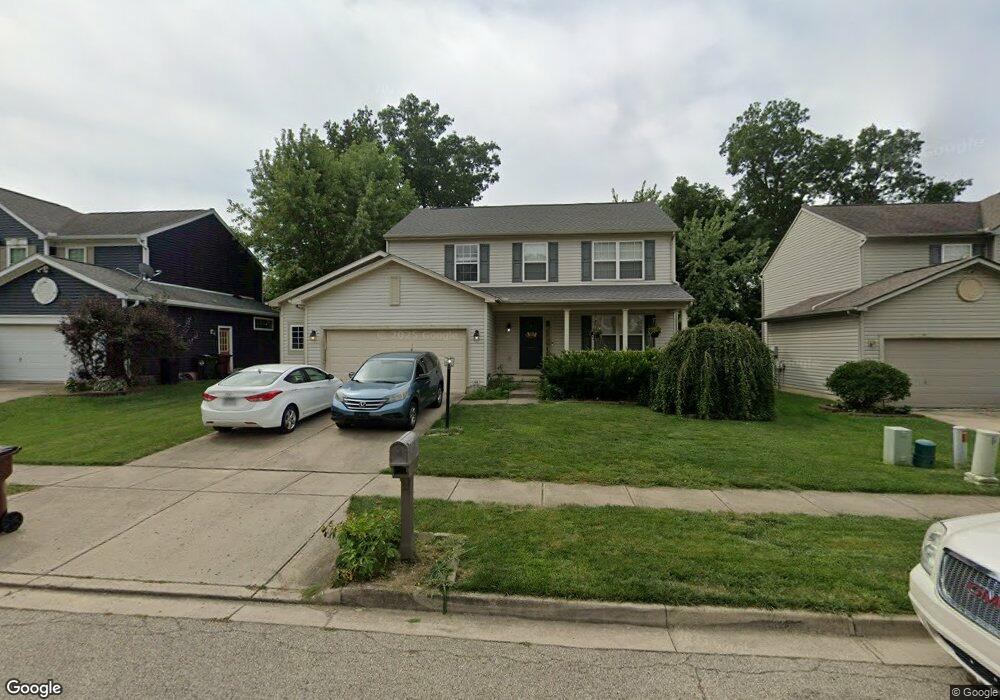
4271 Coventry Ct Beavercreek, OH 45440
Estimated Value: $349,000 - $383,000
4
Beds
3
Baths
1,876
Sq Ft
$194/Sq Ft
Est. Value
About This Home
This home is located at 4271 Coventry Ct, Beavercreek, OH 45440 and is currently estimated at $363,489, approximately $193 per square foot. 4271 Coventry Ct is a home located in Greene County with nearby schools including Fairbrook Elementary School, Herman K Ankeney Middle School, and Beavercreek High School.
Ownership History
Date
Name
Owned For
Owner Type
Purchase Details
Closed on
May 12, 2020
Sold by
Blair Justin A and Blair Samantha
Bought by
Heizer Esley M and Copenhaver Amanda
Current Estimated Value
Home Financials for this Owner
Home Financials are based on the most recent Mortgage that was taken out on this home.
Original Mortgage
$224,600
Outstanding Balance
$199,027
Interest Rate
3.3%
Mortgage Type
New Conventional
Estimated Equity
$164,462
Purchase Details
Closed on
Aug 2, 2017
Sold by
Pag Holding Ltd
Bought by
Blair Justin A
Purchase Details
Closed on
Dec 16, 2012
Sold by
Paradise Arthur D
Bought by
Blair Justin A and Blair Dawn T
Purchase Details
Closed on
Aug 26, 2004
Sold by
Paradise Arthur D
Bought by
Pag Holdings Ltd
Purchase Details
Closed on
Aug 21, 2002
Sold by
The Ryland Group Inc
Bought by
Paradise Arthur D
Create a Home Valuation Report for This Property
The Home Valuation Report is an in-depth analysis detailing your home's value as well as a comparison with similar homes in the area
Home Values in the Area
Average Home Value in this Area
Purchase History
| Date | Buyer | Sale Price | Title Company |
|---|---|---|---|
| Heizer Esley M | $236,500 | Landmark Title Agency Inc | |
| Blair Justin A | $172,500 | -- | |
| Blair Justin A | $172,500 | None Available | |
| Pag Holdings Ltd | -- | -- | |
| Paradise Arthur D | $165,100 | -- |
Source: Public Records
Mortgage History
| Date | Status | Borrower | Loan Amount |
|---|---|---|---|
| Open | Heizer Esley M | $224,600 | |
| Closed | Blair Justin A | $0 |
Source: Public Records
Tax History Compared to Growth
Tax History
| Year | Tax Paid | Tax Assessment Tax Assessment Total Assessment is a certain percentage of the fair market value that is determined by local assessors to be the total taxable value of land and additions on the property. | Land | Improvement |
|---|---|---|---|---|
| 2024 | $6,293 | $94,520 | $18,150 | $76,370 |
| 2023 | $6,293 | $94,520 | $18,150 | $76,370 |
| 2022 | $5,589 | $74,090 | $13,970 | $60,120 |
| 2021 | $5,479 | $69,910 | $13,970 | $55,940 |
| 2020 | $5,208 | $69,910 | $13,970 | $55,940 |
| 2019 | $4,944 | $60,590 | $11,030 | $49,560 |
| 2018 | $4,376 | $60,590 | $11,030 | $49,560 |
| 2017 | $4,518 | $60,590 | $11,030 | $49,560 |
| 2016 | $4,519 | $60,590 | $11,030 | $49,560 |
| 2015 | $4,493 | $60,590 | $11,030 | $49,560 |
| 2014 | $4,427 | $60,590 | $11,030 | $49,560 |
Source: Public Records
Map
Nearby Homes
- 4489 Bucksport Ct
- 4493 Bucksport Ct
- 3170 E Stroop Rd
- 3170 E Stroop Rd Unit 307
- 470 Cloverhill Ct
- 3241 Gracemore Ave
- 3073 Santa Rosa Dr
- 4212 Seema Dr
- 3072 Leonora Dr
- 3033 Glenmere Ct
- 4227 Wagner Rd
- 419 Carleton Dr
- 2841 Corlington Dr
- 97 Apple Blossom Place
- 3978 Indian Ripple Rd
- 24 Rosell Dr
- 2816 Corlington Dr
- 3908 Barrymore Ln
- 185 Rosillo Dr
- 4049 Pepperwell Cir
- 4279 Coventry Ct
- 4267 Coventry Ct
- 4289 Coventry Ct
- 4276 Bristol Dr
- 4272 Bristol Dr
- 4280 Bristol Dr
- 4295 Coventry Ct
- 4286 Bristol Dr
- 4274 Coventry Ct
- 4268 Coventry Ct
- 4282 Coventry Ct
- 4292 Bristol Dr
- 4357 Frontenac Dr
- 4290 Coventry Ct
- 4361 Frontenac Dr
- 4301 Coventry Ct
- 4301 Conventry
- 4353 Frontenac Dr
- 4369 Frontenac Dr
- 4296 Coventry Ct