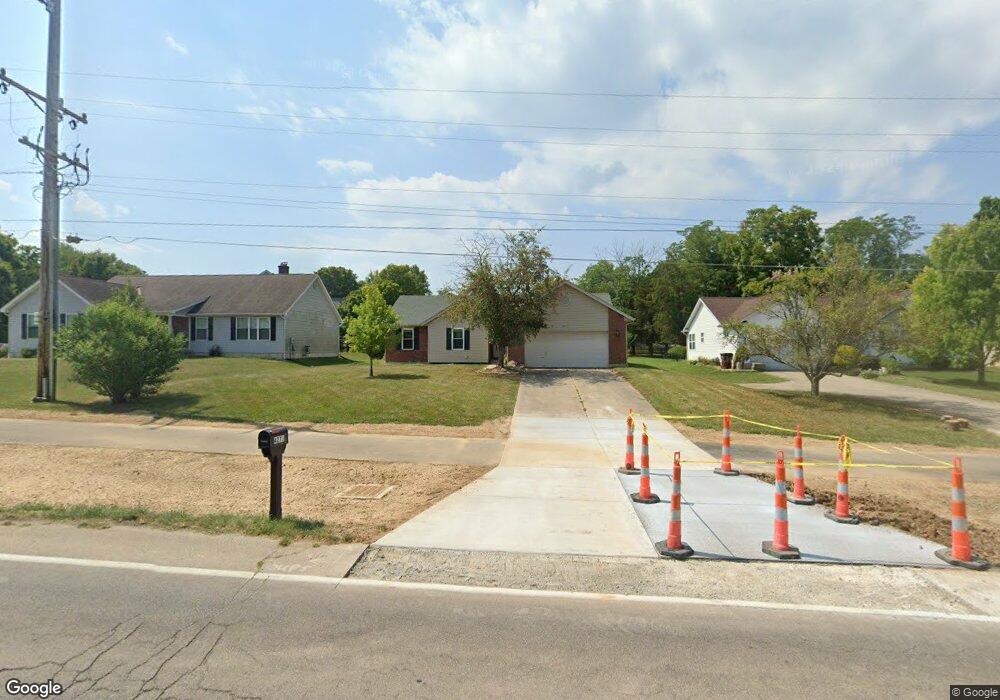
4271 Oxford Reily Rd Oxford, OH 45056
Estimated Value: $274,000 - $340,000
3
Beds
2
Baths
1,336
Sq Ft
$222/Sq Ft
Est. Value
About This Home
This home is located at 4271 Oxford Reily Rd, Oxford, OH 45056 and is currently estimated at $296,925, approximately $222 per square foot. 4271 Oxford Reily Rd is a home located in Butler County with nearby schools including Talawanda Middle School, Talawanda High School, and Mcguffey Montessori School.
Ownership History
Date
Name
Owned For
Owner Type
Purchase Details
Closed on
Jul 12, 2000
Sold by
Mancuso Thomas J and Mancuso Theresa M
Bought by
Dysart Logan B and Dysart Rebecca L
Current Estimated Value
Home Financials for this Owner
Home Financials are based on the most recent Mortgage that was taken out on this home.
Original Mortgage
$132,300
Outstanding Balance
$48,414
Interest Rate
8.55%
Mortgage Type
Purchase Money Mortgage
Estimated Equity
$248,511
Purchase Details
Closed on
Aug 7, 1995
Sold by
Douglas J Ward Trst
Bought by
Mancuso Thomas J and Mancuso Theresa
Purchase Details
Closed on
Jun 13, 1994
Sold by
Western Knolls Inc
Bought by
Douglas J Ward Trustee
Home Financials for this Owner
Home Financials are based on the most recent Mortgage that was taken out on this home.
Original Mortgage
$90,000
Interest Rate
8.45%
Mortgage Type
New Conventional
Create a Home Valuation Report for This Property
The Home Valuation Report is an in-depth analysis detailing your home's value as well as a comparison with similar homes in the area
Home Values in the Area
Average Home Value in this Area
Purchase History
| Date | Buyer | Sale Price | Title Company |
|---|---|---|---|
| Dysart Logan B | $147,000 | -- | |
| Mancuso Thomas J | $125,000 | -- | |
| Douglas J Ward Trustee | $25,500 | -- |
Source: Public Records
Mortgage History
| Date | Status | Borrower | Loan Amount |
|---|---|---|---|
| Open | Dysart Logan B | $132,300 | |
| Previous Owner | Douglas J Ward Trustee | $90,000 | |
| Closed | Mancuso Thomas J | -- |
Source: Public Records
Tax History Compared to Growth
Tax History
| Year | Tax Paid | Tax Assessment Tax Assessment Total Assessment is a certain percentage of the fair market value that is determined by local assessors to be the total taxable value of land and additions on the property. | Land | Improvement |
|---|---|---|---|---|
| 2024 | $2,873 | $77,950 | $16,420 | $61,530 |
| 2023 | $2,757 | $76,800 | $16,420 | $60,380 |
| 2022 | $2,362 | $60,820 | $16,420 | $44,400 |
| 2021 | $2,249 | $60,820 | $16,420 | $44,400 |
| 2020 | $2,352 | $60,820 | $16,420 | $44,400 |
| 2019 | $4,211 | $55,740 | $16,880 | $38,860 |
| 2018 | $2,273 | $55,740 | $16,880 | $38,860 |
| 2017 | $2,043 | $55,740 | $16,880 | $38,860 |
| 2016 | $1,988 | $52,500 | $16,880 | $35,620 |
| 2015 | $2,023 | $52,500 | $16,880 | $35,620 |
| 2014 | $1,905 | $52,500 | $16,880 | $35,620 |
| 2013 | $1,905 | $48,550 | $13,500 | $35,050 |
Source: Public Records
Map
Nearby Homes
- 0 Dana Dr Unit 1860017
- 715 W Chestnut St
- 40 Charleston Dr Unit 4
- 626 W Chestnut St
- 509 White Oak Dr
- 812 Winding Brook Dr
- 6 Autumn Dr
- 446 Emerald Woods Dr
- 620 Brill Dr
- 616 Brill Dr
- 4215 Kehr Rd
- 60 Autumn Dr
- 7 Robin Ct
- 53 Great Horned Dr
- 59 Great Horned Dr
- 1020 Tollgate Dr
- 71 Great Horned Dr
- 74 Great Horned Dr
- 29 Gardenia Dr
- 80 Great Horned Dr
- 4281 Oxford Reily Rd
- 1400 Dana Dr
- 1410 Dana Dr
- 111 Ryan Dr
- 4291 Oxford Reily Rd
- 0 Dana Dr Unit 1197171
- 0 Dana Dr Unit 1290248
- 0 Dana Dr Unit 1315876
- 0 Dana Dr Unit 1361963
- 0 Dana Dr Unit 1733271
- 0 Dana Dr Unit 1690731
- 0 Dana Dr Unit 1585470
- 2010 Dana Dr
- 121 Ryan Dr
- 4260 Oxford Reily Rd
- 1390 Dana Dr
- 4280 Oxford Reily Rd
- 102 Ryan Dr
- 122 Ryan Dr
- 4231 Oxford Reily Rd