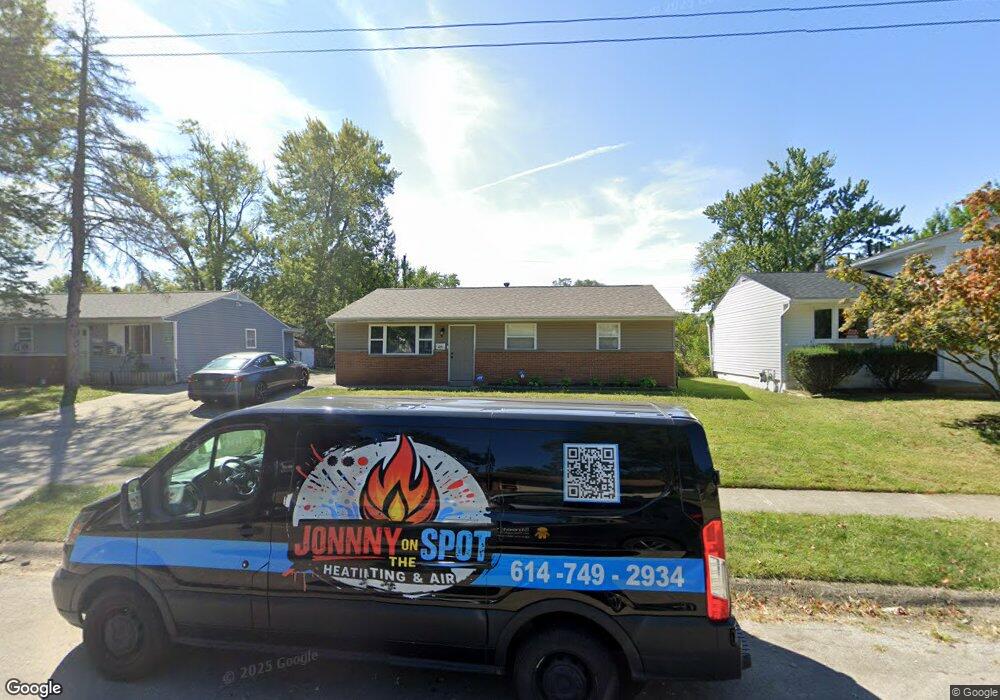
4271 Sibley Ave Columbus, OH 43227
Leawood NeighborhoodEstimated Value: $177,000 - $196,000
3
Beds
2
Baths
1,120
Sq Ft
$163/Sq Ft
Est. Value
About This Home
This home is located at 4271 Sibley Ave, Columbus, OH 43227 and is currently estimated at $182,506, approximately $162 per square foot. 4271 Sibley Ave is a home located in Franklin County with nearby schools including Leawood Elementary School, Sherwood Middle School, and Walnut Ridge High School.
Ownership History
Date
Name
Owned For
Owner Type
Purchase Details
Closed on
Jun 19, 2024
Sold by
Hooks Daniel A
Bought by
Riffle Heaven
Current Estimated Value
Home Financials for this Owner
Home Financials are based on the most recent Mortgage that was taken out on this home.
Original Mortgage
$65,960
Outstanding Balance
$65,120
Interest Rate
7.03%
Mortgage Type
New Conventional
Estimated Equity
$117,386
Purchase Details
Closed on
Jun 15, 2006
Sold by
Jarvis Percy Joanne and Declaratio Joanne Jarvis Percy
Bought by
Hooks Daniel A and Hooks Jayne E
Home Financials for this Owner
Home Financials are based on the most recent Mortgage that was taken out on this home.
Original Mortgage
$96,000
Interest Rate
6.68%
Mortgage Type
Purchase Money Mortgage
Purchase Details
Closed on
Nov 20, 1998
Sold by
Jarvis Percy David M and Jarvis Percy Joanne
Bought by
Percy David M and David M Percy Declaration Trus
Purchase Details
Closed on
Apr 30, 1986
Bought by
Percy David M
Purchase Details
Closed on
Sep 1, 1981
Purchase Details
Closed on
Nov 1, 1980
Create a Home Valuation Report for This Property
The Home Valuation Report is an in-depth analysis detailing your home's value as well as a comparison with similar homes in the area
Home Values in the Area
Average Home Value in this Area
Purchase History
| Date | Buyer | Sale Price | Title Company |
|---|---|---|---|
| Riffle Heaven | $68,000 | Leaders Title Agency | |
| Hooks Daniel A | $99,000 | Lll Title | |
| Percy David M | -- | -- | |
| Declaratio Percy Joanne Jarvis | -- | -- | |
| Percy David M | $42,500 | -- | |
| -- | $37,600 | -- | |
| -- | $36,000 | -- |
Source: Public Records
Mortgage History
| Date | Status | Borrower | Loan Amount |
|---|---|---|---|
| Open | Riffle Heaven | $65,960 | |
| Previous Owner | Hooks Daniel A | $96,000 |
Source: Public Records
Tax History Compared to Growth
Tax History
| Year | Tax Paid | Tax Assessment Tax Assessment Total Assessment is a certain percentage of the fair market value that is determined by local assessors to be the total taxable value of land and additions on the property. | Land | Improvement |
|---|---|---|---|---|
| 2024 | $2,155 | $48,020 | $12,250 | $35,770 |
| 2023 | $2,128 | $48,020 | $12,250 | $35,770 |
| 2022 | $1,491 | $28,740 | $5,780 | $22,960 |
| 2021 | $1,493 | $28,740 | $5,780 | $22,960 |
| 2020 | $1,495 | $28,740 | $5,780 | $22,960 |
| 2019 | $1,410 | $23,240 | $4,620 | $18,620 |
| 2018 | $1,409 | $23,240 | $4,620 | $18,620 |
| 2017 | $1,482 | $23,240 | $4,620 | $18,620 |
| 2016 | $1,554 | $23,460 | $4,240 | $19,220 |
| 2015 | $1,411 | $23,460 | $4,240 | $19,220 |
| 2014 | $1,414 | $23,460 | $4,240 | $19,220 |
| 2013 | $807 | $27,125 | $4,970 | $22,155 |
Source: Public Records
Map
Nearby Homes
- 4295 Colby Ave
- 1543 S Hamilton Rd
- 1490 Elaine Rd Unit 1462
- 4181 Colby Ave
- 1618 S Hamilton Rd
- 4467 Grimsby Rd
- 1291 Westphal Ave
- 1693 Gaynor Rd
- 4484 Grimsby Rd
- 1571 Baxter Dr
- 1635 Elaine Rd
- 4501 Amesbury Rd
- 1752 S Hamilton Rd
- 1563 Genoa Place
- 1281 Maetzel Dr
- 4571 Aragon Ave
- 4530 Amesbury Rd
- 1640 Striebel Rd
- 1656 Vilardo Ln
- 1607 Shady Lane Rd
- 4263 Sibley Ave
- 4279 Sibley Ave
- 4255 Sibley Ave
- 4283 Sibley Ave
- 4266 Conover Place
- 4258 Conover Place
- 4274 Conover Place
- 4291 Sibley Ave
- 4250 Conover Place
- 4274 Sibley Ave
- 4280 Conover Place
- 1496 Wilton Dr
- 4282 Sibley Ave
- 4266 Sibley Ave
- 4258 Sibley Ave
- 1516 Wilton Dr
- 4299 Sibley Ave
- 4288 Conover Place
- 4252 Sibley Ave
- 4294 Sibley Ave