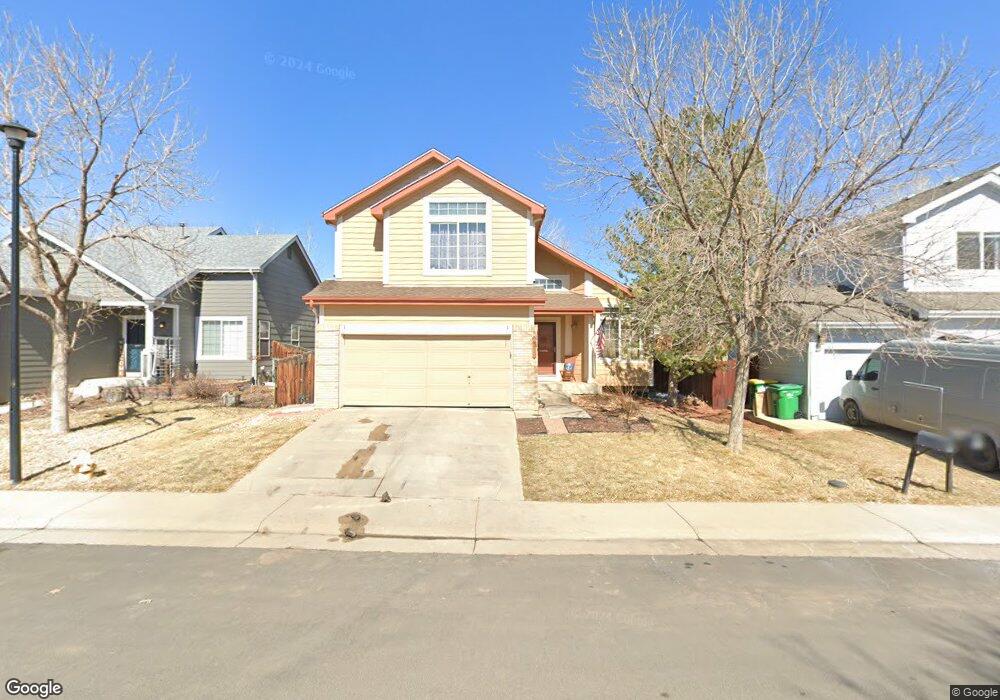
4271 Thorndyke Place Broomfield, CO 80020
Brandywine NeighborhoodEstimated Value: $577,000 - $640,000
3
Beds
3
Baths
1,998
Sq Ft
$307/Sq Ft
Est. Value
About This Home
This home is located at 4271 Thorndyke Place, Broomfield, CO 80020 and is currently estimated at $614,354, approximately $307 per square foot. 4271 Thorndyke Place is a home located in Broomfield County with nearby schools including Mountain View Elementary School, Westlake Middle School, and Legacy High School.
Ownership History
Date
Name
Owned For
Owner Type
Purchase Details
Closed on
Jan 20, 2012
Sold by
Baldwin Matthew T
Bought by
Gu Youfan and Shi Xiaoyan
Current Estimated Value
Purchase Details
Closed on
Feb 24, 2005
Sold by
French David R and French Joyce L
Bought by
Baldwin Matthew T
Home Financials for this Owner
Home Financials are based on the most recent Mortgage that was taken out on this home.
Original Mortgage
$226,598
Interest Rate
5.77%
Mortgage Type
FHA
Purchase Details
Closed on
Dec 31, 1998
Sold by
U S Home Corporation
Bought by
French David R and French Joyce L
Purchase Details
Closed on
Aug 28, 1998
Sold by
U S Home Corporation
Bought by
French David R and French Joyce L
Purchase Details
Closed on
Mar 16, 1998
Sold by
Shea Homes Limited Partnership
Bought by
U S Home Corporation
Purchase Details
Closed on
Oct 6, 1997
Sold by
Mission Viejo Company
Bought by
Shea Homes Limited Partnership
Create a Home Valuation Report for This Property
The Home Valuation Report is an in-depth analysis detailing your home's value as well as a comparison with similar homes in the area
Home Values in the Area
Average Home Value in this Area
Purchase History
| Date | Buyer | Sale Price | Title Company |
|---|---|---|---|
| Gu Youfan | $215,000 | Guardian Title | |
| Baldwin Matthew T | $235,000 | Guardian Title | |
| French David R | -- | -- | |
| French David R | $157,600 | -- | |
| U S Home Corporation | $70,100 | -- | |
| Shea Homes Limited Partnership | -- | -- |
Source: Public Records
Mortgage History
| Date | Status | Borrower | Loan Amount |
|---|---|---|---|
| Previous Owner | Baldwin Matthew T | $226,598 |
Source: Public Records
Tax History Compared to Growth
Tax History
| Year | Tax Paid | Tax Assessment Tax Assessment Total Assessment is a certain percentage of the fair market value that is determined by local assessors to be the total taxable value of land and additions on the property. | Land | Improvement |
|---|---|---|---|---|
| 2025 | $4,039 | $38,970 | $9,050 | $29,920 |
| 2024 | $4,039 | $37,660 | $8,240 | $29,420 |
| 2023 | $4,002 | $42,880 | $9,380 | $33,500 |
| 2022 | $3,339 | $29,560 | $6,600 | $22,960 |
| 2021 | $3,443 | $30,410 | $6,790 | $23,620 |
| 2020 | $3,299 | $28,820 | $6,440 | $22,380 |
| 2019 | $3,301 | $29,020 | $6,480 | $22,540 |
| 2018 | $2,918 | $24,740 | $4,680 | $20,060 |
| 2017 | $2,658 | $27,350 | $5,170 | $22,180 |
| 2016 | $2,410 | $21,860 | $5,050 | $16,810 |
| 2015 | $2,410 | $17,110 | $5,050 | $12,060 |
| 2014 | $1,938 | $17,110 | $5,050 | $12,060 |
Source: Public Records
Map
Nearby Homes
- 3974 Cambridge Ave
- 3981 W 127th Ave
- 12545 Tammywood St
- 12450 Forest View St
- 12695 Wolff St
- 12510 Newton St
- 12620 Winona Ct
- 12205 Pery St
- 12805 King St
- 5005 W 128th Place
- 13005 Lowell Ct
- 12217 Crabapple St
- 12528 James Point
- 12639 James Ct
- 3465 W 125th Point
- 12205 Perry St Unit 17
- 12205 Perry St Unit 259
- 12205 Perry St Unit 167
- 12205 Perry St Unit 67
- 12205 Perry St Unit 287
- 4287 Thorndyke Place
- 4269 Thorndyke Place
- 4278 Cambridge Ave
- 4255 Thorndyke Place
- 4315 Thorndyke Place
- 4286 Cambridge Ave
- 4260 Cambridge Ave
- 4316 Cambridge Ave
- 4256 Cambridge Ave
- 4274 Thorndyke Place
- 4111 Thorndyke Place
- 4284 Thorndyke Place
- 4246 Thorndyke Place
- 4250 Thorndyke Place
- 4118 Cambridge Ave
- 4327 Thorndyke Place
- 4318 Thorndyke Place
- 4109 Thorndyke Place
- 4116 Thorndyke Place
- 4326 Cambridge Ave