4272 26th St Boulder, CO 80304
North Boulder NeighborhoodEstimated Value: $1,028,757 - $1,445,000
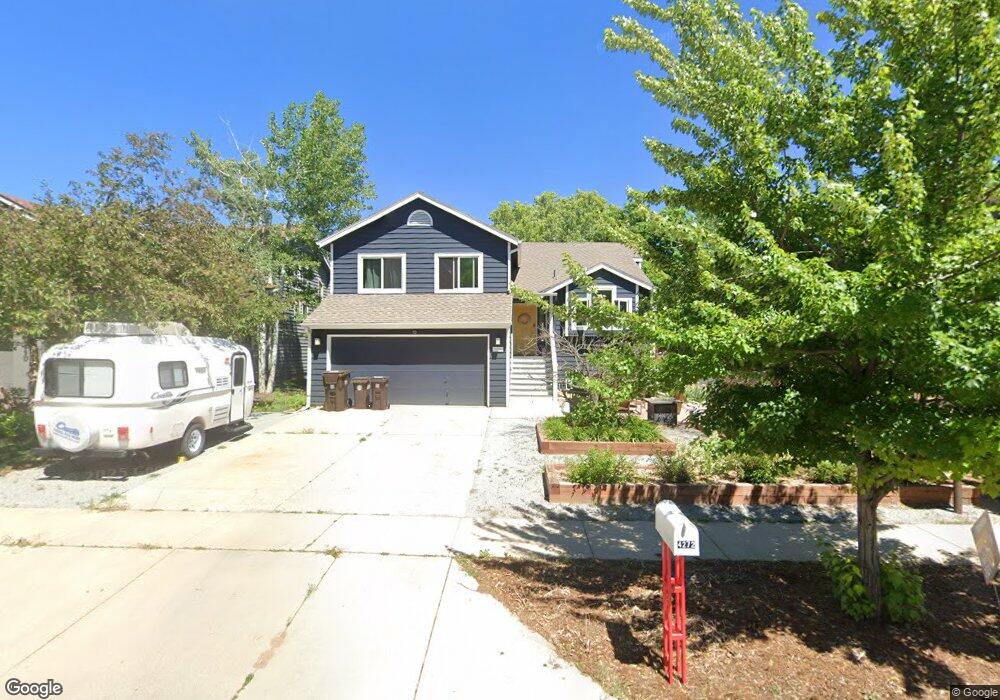
About This Home
This home is located at 4272 26th St, Boulder, CO 80304 and is currently estimated at $1,161,439, approximately $503 per square foot. 4272 26th St is a home located in Boulder County with nearby schools including Crest View Elementary School, Centennial Middle School, and Boulder High School.
Ownership History
We collect this data history from publicly available records. To have your information removed, we recommend requesting removal directly through your county’s website.
Purchase Details
Purchase Details
Home Financials for this Owner
Home Financials are based on the most recent Mortgage that was taken out on this home.Purchase Details
Home Financials for this Owner
Home Financials are based on the most recent Mortgage that was taken out on this home.Purchase Details
Home Financials for this Owner
Home Financials are based on the most recent Mortgage that was taken out on this home.Purchase Details
Purchase Details
Purchase Details
Home Values in the Area
Average Home Value in this Area
Purchase History
We collect this data history from publicly available records. To have your information removed, we recommend requesting removal directly through your county’s website.
| Date | Buyer | Sale Price | Title Company |
|---|---|---|---|
| -- | None Available | ||
| $470,000 | Guardian Title Agency Llc | ||
| $380,000 | -- | ||
| $247,500 | -- | ||
| -- | -- | ||
| $153,100 | -- | ||
| -- | -- |
Mortgage History
We collect this data history from publicly available records. To have your information removed, we recommend requesting removal directly through your county’s website.
| Date | Status | Borrower | Loan Amount |
|---|---|---|---|
| Open | $370,000 | ||
| Previous Owner | $342,000 | ||
| Previous Owner | $198,000 |
Tax History
We collect this data history from publicly available records. To have your information removed, we recommend requesting removal directly through your county’s website.
| Year | Tax Paid | Tax Assessment Tax Assessment Total Assessment is a certain percentage of the fair market value that is determined by local assessors to be the total taxable value of land and additions on the property. | Land | Improvement |
|---|---|---|---|---|
| 2025 | $6,618 | $75,521 | $32,361 | $43,160 |
| 2024 | $6,852 | $69,413 | $29,744 | $39,669 |
| 2023 | $6,733 | $77,961 | $32,160 | $49,486 |
| 2022 | $5,956 | $64,141 | $28,599 | $35,542 |
| 2021 | $5,680 | $65,987 | $29,422 | $36,565 |
| 2020 | $4,977 | $57,172 | $28,243 | $28,929 |
| 2019 | $4,900 | $57,172 | $28,243 | $28,929 |
| 2018 | $4,681 | $53,986 | $25,200 | $28,786 |
| 2017 | $4,534 | $59,684 | $27,860 | $31,824 |
| 2016 | $4,187 | $48,365 | $23,721 | $24,644 |
| 2015 | $3,965 | $35,796 | $12,656 | $23,140 |
| 2014 | $3,010 | $35,796 | $12,656 | $23,140 |
Map
- 4251 Amber St
- 4227 Amber St
- 4219 Amber St
- 2541 Tamarack Ave
- 2525 Topaz Dr
- 2170 Vine Ave
- 2145 Vine Ave
- 2158 Tamarack Ave
- 2125 Vine Ave
- 2558 Premier Place
- 2512 Premier Place
- 1952 Vine Ave
- 2093 Tamarack Ave
- 4156 Culebra Ct
- 2734 Northbrook Place
- 4500 19th St Unit 289
- 4500 19th St Unit 643
- 4500 19th St Unit 33
- 4500 19th St
- 4500 19th St Unit 178
Ask me questions while you tour the home.